Maxim Integ. Prod. (MXIM)
SSG and PERT | Google Stocks | Company Website

Maxim reported earnings for the fiscal year ending June 24, 2006. The company reported revenue growth of 11.2%. However, net income fell (-14.4%)and diluted EPS fell (14.9%) from $1.578 to $1.372. See Maxim’s press release. The expensing of stock based compensation contributed to the poor earnings.
Maxim and Linear Technologies (LLTC) are similar companies with different niches in the semiconducter industry. They had similar results this year, increased revenue growth but declining earnings. LLTC’s EPS did not decline as much as that of MXIM.
Should we sell MXIM? The short answer is no. The company’s fundamentals — the basis on which we buy or hold stocks — still look very good. On Friday, Maxim reported record-high quarterly revenue as bookings. The company has no long term debt. Net profit margins have remained strong. Value Line projects 20% sales growth and 15.5% earnings growth. The analysts consensus for 5-year earnings growth rate is 20%. Morningstar gives Maxim a 5-start rating (meaning it is priced well below fair value), a wide moat, and a stewardship grade of B. Manifest Investing rates its quality 69.
Whenever the earnings of a growth company falter, the price of the stock usually tumbles. Maxim’s stock price is near its three year low even though the company’s fundamentals and business model appear to be intact.
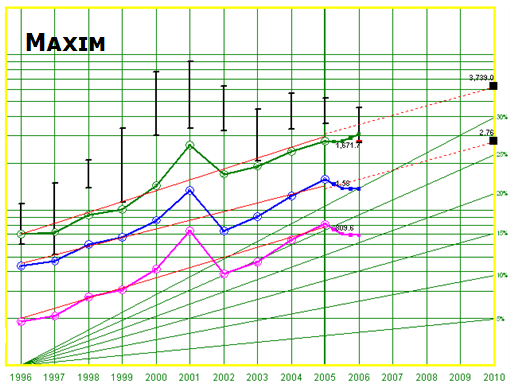
We currently hold 58 shares of Maxim valued at $2,090. It is 4.3% of our portfolio. Our average cost is $35.88 per share. The current share price is $27.94. We have a net loss of $462. (We also have a net loss for Intel, another semiconductor stock.) Revising the stock selection guide for a projected 15% EPS growth, projected average return is 21.5%. At his point, we probably have more to gain than lose by holding Maxim.
(more…)
Report for July 2006
In July, the Moose Pond Investors portfolio declined 0.13% while the S&P 500 increased 0.52%. Year to date, the portfolio declined 0.12% while the S&P increased 2.28%. The unit value of a share was $13.12 on July 31.
The biggest gainers in July were Pfizer (PFE) +10.8%, Stryker Corp. (SYK) +8.1%, and Brown & Co. (BRO) +7.4%. The biggest losers were Capital One Financial (COF) -9.5%, Maxim Integrated products (MXIM) -8.5%, and Factset Research (FDS) -7.2%.
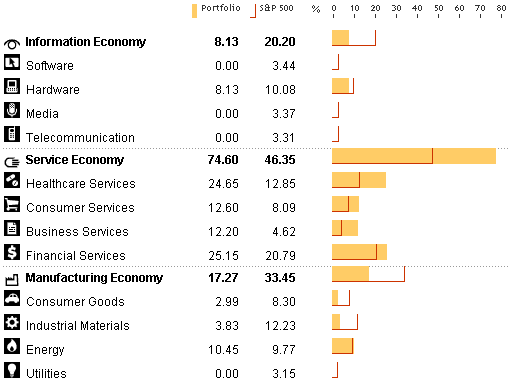
The portfolio remains diversified with 25 holdings. The following chart from Morningstar compares the sector diversification of the portfolio with the S&P 500. In adding to the portfolio, we should probably avoid further overweighting of the services sector.
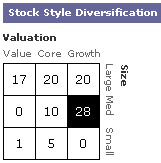 As the chart on the rights shows, the portfolio consists of large cap (57%), medium cap (38%), and small cap (65%) stocks. We should focus on finding more medium and small cap stocks.
Looking at style, the portfolio consist of value (18%), blend (35%), and growth (48%). This mix is probably OK but growth stocks have taking quite a drubbing over the past 12 months. (For a comparison of growth and value stock returns by year see the Callan Periodic Table.)