Investing Podcasts
Learning about investing is a continuous process. There are several radio programs that are available in digital (MP3) format. These “podcasts” can be downloaded and played at your convenience through a computer or with an MP3 player. Here are several excellent programs.
The Wise Investor Show has been broadcast in the Washington, DC, area for 17 years. The program advocates a conservative, value-oriented approach to investing. The program is always informative and educational. The weekly program can be downloaded from the WMAL.com website. Currently, the program is only archived one week at a time, with the Sunday program becoming available on Monday. The program lasts about 2 hours.
Paul Douglas Boyer, who happens to live near here in Vienna, Virginia, has a blog and a podcast that discusses fun investment topics and reviews the Mad Money recommendations of guru Jim Cramer. His weekly podcast last about 30 minutes and is entertaining and well produced. The program advocates an asset allocation strategy. Both podcasts and model portfolios can be found on the Mad Money Machine.com website.
Jim Cramer is interesting, educational, and, at times, controversial. He has a daily radio program that lasts about 30 minutes. Podcasts for the radio program can be found on the TheStreet.com website. He advocates a trading approach with a small percentage of a portfolio. While his near term trading philosophy differs significantly from an NAIC-approach, he often offers interesting and insightful perspectives. His book Real Money: Sane Investing in an Insane World is well worth reading.
It is easy to become a fan of podcasts. You can find podcasts on many different subjects, not just investing. They allow time shifting. With an inexpensive MP3 player, you can listen to a podcast in the car, while walking, or while exercising. Apple offers a free program called iTunes. It includes a link to a podcast directory maintained by Apple. It can be configured to manage your podcasts by automatically downloading new programs and deleting old ones.
YTD Returns
Following up on the earlier posting, this performance report shows year-to-date return for each stock in the portfolio. Stocks with more than 10% return (up or down) are highlighted in yellow. A number of our high quality stocks, have not done well this year.
Stocks down more than 10% year-to-date: COF (-22.9%), LOW (-20.5%), INTC (-16.7%), MMC (-16.1%), AMGN (-13.7%), ACS (-13.2%), and PDCO (-13.0%), Stocks up more than 10% year-to-date: OXY (29.1%), IFIN (+26.0%), PFE (+20.5%), CVX (+15.4%), and SNV (+12.8%). Note that the YTD return is simply a snapshot in time. It does not reflect the overall, long term return we have achieved for these stocks.
We need to to be patient. The business models seem intact for each of the stocks that have declined. (Although we do need to take a hard look at MMC.)
September Observations
In terms of investment return, we been treading water for most of 2006. The value of a unit in the funds is almost where it was when we started the year. We have an excellent portfolio. Although it is weight more heavily with larger growth stocks.
In general terms, stocks that have consistent increases in earnings and revenue, at a rate faster than the growth of the economy, are characterized as growth stocks. In contrast, stocks with a low price-to-book (P/B) ratio and low price-to earings (P/E) ratio are characterized as value stocks. Mutual funds are frequently characterized as either growth, value, or blend (a combination of growth and value). Mutual funds are further characterized as large, medium, or small capitalization. Market capitalization is simply the number of shares issues time the market price of share of stock.
All of this is a leading up to the observation that large capitalization stocks have not done as well as value stocks. Similarly, growth stocks have not done as well as value stocks, in the last 12 months or so. The Callen Periodic Table of Investing Returns shows how different sectors (large, medium, and small capitalization, and growth, value, and blend) have different returns from year to year.
So what do we do at this point? Stay the course. We have an excellent portfolio, even though it is weighted more heavily in larger growth stocks. As we buy more stocks, we should look for opportunities in smaller stocks, especially smaller growth stocks that are cheaply priced.
You can see how growth, value, and market capitalization interact, using this spreadsheet. The spreadsheet calculates return for a portfolio over the last 15 years based on the asset classes in the portfolio. The S&P 500 is a good surrogate for large capitalization stocks. Similarly, the Russell 2000 is a good proxy for small capitalization stocks.
To compare investment returns, enter a number, e.g., “100” in the blue column for the asset class you want to examine and “0” for all others. You can also look at the return of various combination of asset classes. You might find this spreadsheet helpful if you are trying to decide how to allocate long term savings.
After a great deal of research, I see considerable merit in having a substantial amount of core savings allocated among index funds that represent these asset classes. I am paying much closer attention to asset classes. (Moose pond Investors is really a large/medium cap, growth asset class.) Asset allocation might be the subject of a future posting if there is any interest. But for now, the returns of the various asset classes will help explain why the Moose Pond returns have not been stellar this year.
Maxim Integ. Prod. (MXIM)
SSG and PERT | Google Stocks | Company Website

Maxim reported earnings for the fiscal year ending June 24, 2006. The company reported revenue growth of 11.2%. However, net income fell (-14.4%)and diluted EPS fell (14.9%) from $1.578 to $1.372. See Maxim’s press release. The expensing of stock based compensation contributed to the poor earnings.
Maxim and Linear Technologies (LLTC) are similar companies with different niches in the semiconducter industry. They had similar results this year, increased revenue growth but declining earnings. LLTC’s EPS did not decline as much as that of MXIM.
Should we sell MXIM? The short answer is no. The company’s fundamentals — the basis on which we buy or hold stocks — still look very good. On Friday, Maxim reported record-high quarterly revenue as bookings. The company has no long term debt. Net profit margins have remained strong. Value Line projects 20% sales growth and 15.5% earnings growth. The analysts consensus for 5-year earnings growth rate is 20%. Morningstar gives Maxim a 5-start rating (meaning it is priced well below fair value), a wide moat, and a stewardship grade of B. Manifest Investing rates its quality 69.
Whenever the earnings of a growth company falter, the price of the stock usually tumbles. Maxim’s stock price is near its three year low even though the company’s fundamentals and business model appear to be intact.
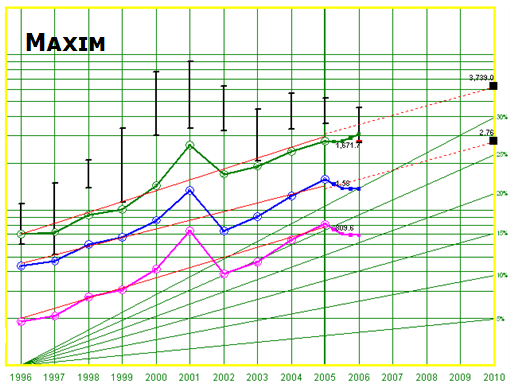
We currently hold 58 shares of Maxim valued at $2,090. It is 4.3% of our portfolio. Our average cost is $35.88 per share. The current share price is $27.94. We have a net loss of $462. (We also have a net loss for Intel, another semiconductor stock.) Revising the stock selection guide for a projected 15% EPS growth, projected average return is 21.5%. At his point, we probably have more to gain than lose by holding Maxim.
(more…)
Report for July 2006
In July, the Moose Pond Investors portfolio declined 0.13% while the S&P 500 increased 0.52%. Year to date, the portfolio declined 0.12% while the S&P increased 2.28%. The unit value of a share was $13.12 on July 31.
The biggest gainers in July were Pfizer (PFE) +10.8%, Stryker Corp. (SYK) +8.1%, and Brown & Co. (BRO) +7.4%. The biggest losers were Capital One Financial (COF) -9.5%, Maxim Integrated products (MXIM) -8.5%, and Factset Research (FDS) -7.2%.
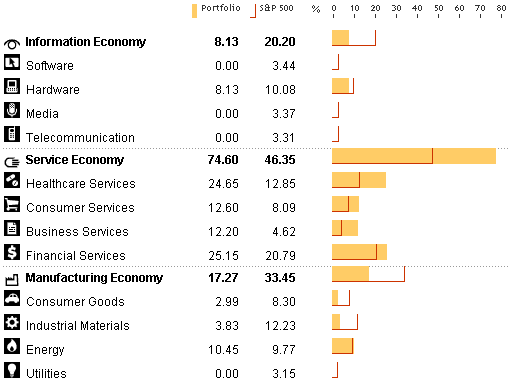
The portfolio remains diversified with 25 holdings. The following chart from Morningstar compares the sector diversification of the portfolio with the S&P 500. In adding to the portfolio, we should probably avoid further overweighting of the services sector.
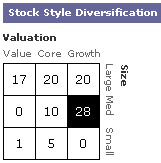 As the chart on the rights shows, the portfolio consists of large cap (57%), medium cap (38%), and small cap (65%) stocks. We should focus on finding more medium and small cap stocks.
Looking at style, the portfolio consist of value (18%), blend (35%), and growth (48%). This mix is probably OK but growth stocks have taking quite a drubbing over the past 12 months. (For a comparison of growth and value stock returns by year see the Callan Periodic Table.)
SSGs Updated
The stock selection guides (SSGs) for each of the stocks in the portfolio have been updated as of June 30. Follow the links in the portfolio summary for the current SSGs.
The PERT Chart and Trend Report also have been updated. The PERT chart is sorted by total return while the trend report is sorted by projected average return.