As we head into the fall season, the equity market has improved significantly from its bleak lows in March. However, even though we are beating the S&P 500 (an index of large caps stocks) our portfolio has not fully recovered. Year-to-date, we are up 17.4% compared to 15.1% for the S&P500.
There are several tools, some of which were developed by NAIC / BetterInvesting for looking at an entire portfolio. The portfolio evaluation review technique or “PERT” takes data from individual stock selection guides and creates a table. Sorting this information allows identification of the outliers.
PERT Report. Here is the PERT Report for the Mose Pond Investors portfolio. This report is sorted on estimated total return, lowest to highest. Looking at the low end, several companies in our portfolio stand out as being candidates for replacement, e.g., AIG, Helmerich & Payne (HP), and Illinois Tools Works (ITW).
Before making any decisions based on the PERT report, it is important to understand how Toolkit 6 calculates total % return. The PERT report uses the estimated earnings per share (EPS) for the next 12 months and extends those earnings for four more years (for a total of five years) using the EPS growth rate from section 1 of the SSG. The 5-year estimated EPS is multiplied by the estimated future PE (which is the average of the high and low PE from section 4 of the stock selection guide). This give an expended price in five years. 5-year price appreciation then is a simple calculation — [(Future Price / Present Price) ^ (1/5)] – 1.
The total return is the the sum of the price appreciation in percent and the average dividend payout in percent. This may sound complicated, but it is not. The total return calculation depends on the accuracy of the 12 month projected EPS, the applied 5-year EPS growth rate and the estimated future PE. Despite the wonderful precision of the software, PAR is just a reasoned guess based on three independent variables.
The return on any stock is a function of only three variables: earnings, dividends, and valuation (i.e., the price to earnings ratio). When we try to predict earnings or PE ratios five years into the future, we must use judgment and we are often wrong. That is why we revisit our judgment each quarter as companies publish new earnings reports.
Trend Report. This Trend Report looks at the trend of the operations of the companies in the portfolio over two consecutive quarters relative to earnings, sales, and pre-tax profit in order to view the “trend of the trends.” The report also includes total return (as described above) and projected average return or PAR.
Projected average return or PAR is calculated in a manner similar to similar to total return except that we use Section 1 of the stock section guide rather than the analysts 12-month estimates for future EPS. There are several different techniques for estimating future EPS, but projected average return or PAR is based largely on the 5-year estimated EPS in Section 1 of the SSG. The total return and PAR sometimes differ. This simple reflects the different approaches to calculating 5-year EPS.
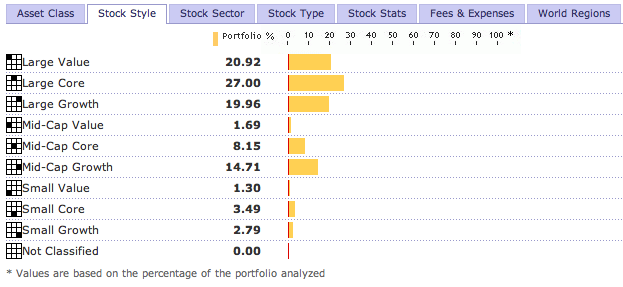
Portfolio Allocation. It is important to understand how what asset classes are included in a portfolio. For U.S. equities, we generally characterize a stock as small, medium, or large based either ion market capitalization or total revenue. We also use fundamental analysis to characterize a stock a growth, value, or in between. In a globalized economy, it is helpful to know the extent to which a company’s revenue come from outside the U.S.
Academic studies have show that small cap stocks out perform large cap stocks over time. Similarly, value stocks tend to slightly out perform growth stocks over long periods. Also diversifying a portfolio over multiple asset classes tends to reduce risk and improve ove7rall performance.
Morningstar provides an excellent “X-Ray” tool for looking at the style and sector characteristics of a portfolio. Here are the X-Ray summaries for the Mose Pond Investors portfolio by style and sector. These reports suggest that the portfolio may be overweighted to large cap stocks.
As if all these views of our portfolio were no confusing enough, there is one more. The Manifest Investing portfolio dashboard is helpful. It shows quality and PAR for the portfolio. For the reasons discussed above, our calculation of PAR may not agree with those on Manifest Investing. However, the portfolio dashboard does provide an easy way to find outliers which require more analysis. The portfolio dashboard also provides any easy why to decide where to apply additional case (i.e., those companies with high quality and high PAR that reflect a small percentage of the overall portfolio. Conversely, the portfolio dashboard can be used to find stocks to replace (i.e., those with low PAR or quality that reflect a large percentage of the portfolio.