Parking Your Safe Money
This is a response to a question by one of my young adult children. She was looking for a place to put some safe money (i.e., funds that she might need in the next 1-3 years) and wanted to obtain a better rate of interest than that offered by her bank.
Vanguard money market funds are a good place to park money that you may need in the next 1-3 years. At your tax bracket, I would not worry about finding a tax-free fund. Tax free money market funds don’t become advantageous until you reach the 28% tax bracket or higher. You can ask Vanguard for a check book for your money market account and redeem shares by check. However, the check has to be $250 or more.
Here are three suggestions. The fund are listed with the safest funds first. The spread between the Treasury-based fund and the prime rate fund is very small. It comes out to about a $25 per year difference on $10,000. So you might want to stay with safety (either Treasury or Federal). That way if the world goes nuts, your funds will be secure. (more…)
First Quarter 2007
For the quarter ending March 30, the Moose Pond portfolio increased in value by 2.9%. In comparison, the S&P 500 increased 0.18% for the same period. See the portfolio performance report for the quarter.
The top five advancers for the quarter were SYK (+20.8%), IFIN (+16.9%), GYI (+13.6%).,CAH (+13.4%), and JKHY (+12.7%). The laggards were AMGN (-18.2%), JNJ (-8.4%), INTC (-5.0%), CBH (-5.0), and BRO (-3.9).
Other than normal dividend reinvestment activity, we bought WAG and added to our position in JNJ. We bought more Vanguard total stock market index (an exchange traded fund) as a holding place for funds available to invest. We sold UTSI and IFIN. (IFIN was acquired by another company.)
Good News for January
For the month of January, the Moose Pond portfolio is up 3.6% (in comparison with 1.4% for the S&P 500). We may be back on track. As of today, Feb 2, the portfolio return is up 4.5%, compared with 1.95% for the S&P 500. That is good news!
This month we sold UTStarcom (UTSI) for a loss of $717 and Investors Financial (IFIN) for gain $199. We are 6.8% in cash. We will be using some of that cash to round out our holdings of Walgreens (WAG) and will park the rest in the Vanguard Total Market Index (VTI).
Getty Images really took off this month, up 15%. They did better than the analysts expected. We are back in the black for that stock.
We have two stocks that have doubled since we bought them. Lowes (LOW), one of our first stocks, is up 248% for an annualized return of 22.4%. Factset Research Service (FDS) is up 123% for an annualized return of 32.3%. We need a few more stocks like them.
You can see the entire portfolio at Manifest Investing.
Annual Report for 2006
In 2006 we had a total return of 6.1%. The value of a unit increased from $13.097 to $13.894. While our return was positive, it lagged behind most of the major market indices. For the first time, we are slightly behind the S&P 500 for a five year period (5.9% vs. 6.2%). Portfolio turnover was about 10%. You can find the annual report for Moose Pond Investors here.
More information about the performance of individual stocks in 2006 can be found in the diversification report and performance report.
How Are We Doing?
So how are we doing so far this year on return? The answer is OK, but not as well as we should be doing. We have an internal rate of return of 7.3% year to date. (Internal rate of return takes into account when we receive funds. It is a more accurate measure of performance.) 7.3% is in line with the Wilshire Large Growth Stock index which is up 8.5%. However, some of the broader market indices have done much better, such as the the Wilshire 5000 which reflects the total market, is up 13.2% for the year.
How we are doing depends on the index to which we compare our portfolio performance. Here is a table showing year to date return data taken from the Wall Street Journal as of Wednesday, November 22.
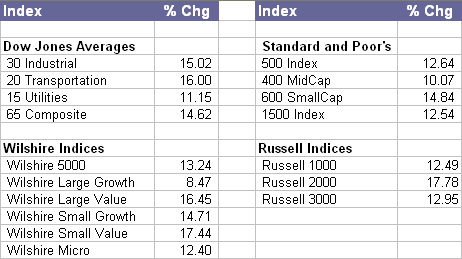
Note that value stocks and small stocks have out performed both large and growth stocks. This has been a trend for a number of recent years. If you want to compare investment returns by asset class (large, small, value growth, etc.) take a look at the Callan Periodic Table of Investment Returns.
 As you can see from the matrix on the right, our portfolio is weighted heavily toward large growth stocks. It was only some recent purchases of GYI and VTI that improved our style balance. Large growth stocks have not done as well as the smaller stocks and the value stocks this year. We need to include more small and medium size companies in our portfolio. It may be inconsistent with an NAIC approach, but we also need some value stocks. Value stocks are generally defined as ones have lower price to earnings or low price to book ratios.
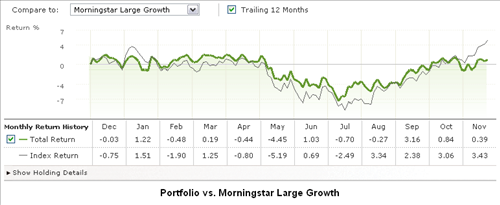
The next two graphs compare our portfolio return over the past 12 months with two Morningstar indices. The first graph compares our return to the Morningstar large growth index. Our return tracks that index fairly closely.
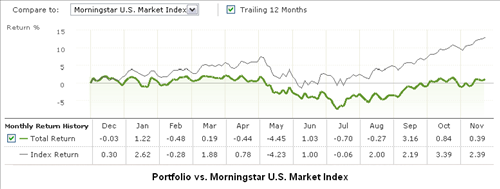
The second graph, below, compares our return with the Morningstar U.S. market index. This is a broad index that includes all stocks. We are not doing as well as that index.
+GYI +WAG -ACS -MMC
Based on our email discussion, we sold Affiliated Computer Services and Marsh & McClennan Companies. We took an initial position in Getty Images and Walgreen Co. (The links will take you to the stock selection guide we used.) We can purchase more of these when either of these stocks dip in price.
These two additions have raised the overall quality rating (now 70.3) and the projected average return (12.3%). See portfolio dashboard here.
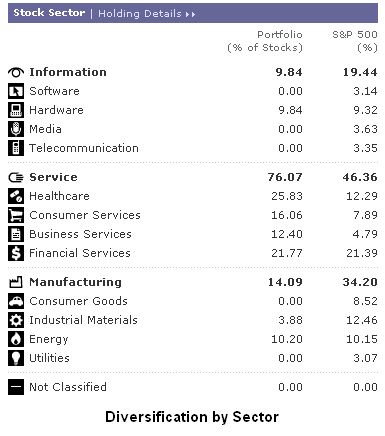
Looking at portfolio diversification, we are diversified across seven sectors. We are still weighted a little too heavy in the health care sector. Here is table from Morningstar showing our actual diversification.