We still consider Almost Family to be a buy. Â See stock selection guide below.
SSG – 31 Dec 2010 Company Website
Purchased 62.937 shares on 11 October 2010 for $1,997 @ $31.73
2013 is behind us. It was an excellent year for stocks. Our portfolio had a total return of 30.1%. We had mostly gainers, including SYNT (+68.5%), CRR (+68.5%), GOOG (58.3%), CSX (+49.1%), and MSFT (+44.1%). Of the stocks we kept in our portfolio, we only had one loser, BRLI (-10.8%).
When we started Moose Pond Investors in October 2000, a share was worth $10.00. Today, a share is worth $23.719. Our annualized internal rate of return from October 2000 to now is 9.1%. The S&P 500, with dividends reinvested, had an internal rate of return of 8.4% for the same period.
Let’s go forward with reasonable expectations for 2014. It is most unlikely — almost certain — that we will not see the same gains in 2014 that we saw in 2013 or even 2012. Markets always revert to the mean. A downward correction in 2014 is possible. (Remember, a reasonable long term expectation for total stock market return is about 8% per year.)
We will continue to do what we have done for 13 years, look for quality growth companies that are reasonably valued. We will stay close to fully invested in equities. One of the keys to success in investing is to view down markets as a buying opportunity and to remain fully invested. There are probably people who can time the market, I have just not found any in more than 40 years of investing.
We wish everyone happy and prosperous New Year.
Are we diversified? The answer is mostly yes. It depends on how you define diversification.
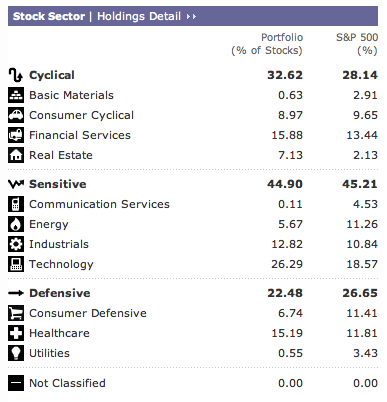
We are reasonably well diversified among the industrial sectors. The following summary from MorningStar X-ray compares our portfolio holdings with the S&P 500.

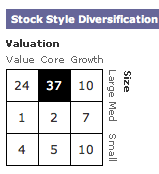
In terms of company size (market capitalization), we are 71% large-cap, 10% mid-cap, and 19% small-cap. In growth vs. value, we are 27% growth, 29% value, and 44% core or blend. Our large-cap holdings lean toward value while our small cap holdings lean toward growth.

We do have 6% of our portfolio in a real estate investment trust ETF (VNQ). This provides some diversification among asset classes. The only international exposure we have is for those US companies in our portfolio that do business overseas.
To sum it up, we are fairly well diversified among US stocks. We could stand to have a little more mid-cap and small-cap representation in the portfolio. We also could have more international equity exposure. This is probably best done through an index ETF.
We have had an excellent year thus far in 2012. Our annualized return (with only one week to go) is 19.6%. Our total return would be over 20% if our esteemed Congressional representatives would stop playing chicken with the nation’s “fiscal cliff.”
Here are the stocks that contributed to our return. At the top of the list is Apple, despite its precipitous fall from slightly over $700 per share. Our three index funds–representing asset classes which are difficult to buy on a stock-by-stock basis–are all doing well.
Surprisingly, Intel is in negative territory for the year. However the stock selection guide indicates that it is still a “buy”. It’s too bad that it takes so long for the market to understand what we do!
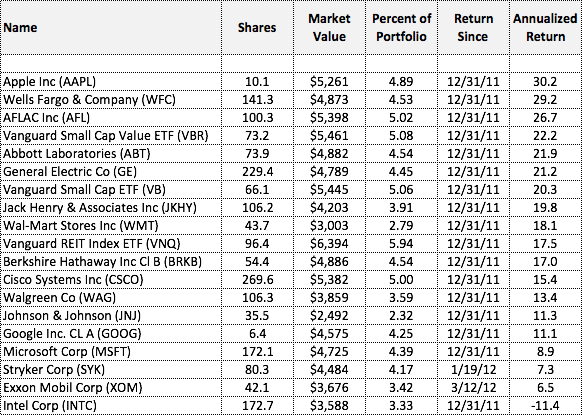
The following table shows our return by stock on an annualized basis. (The actual return your-to-date is slightly lower.) We have held Stryker and Exxon for more than nine months but less than a year.

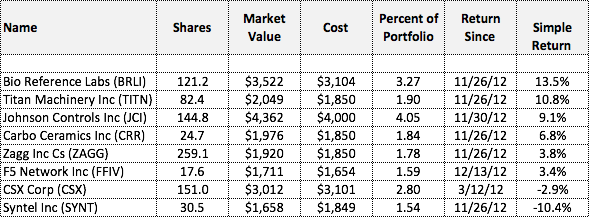
Here is a similar table for the stocks that we have owned for less than 9 months. The table only shows simple return. There are several small stocks in this group. We have taken the approach of buying half positions in small stocks rather than full positions. This gives us some additional diversification by allowing us to hold more small stocks.Â

Overall we had a good year. The Moose Pond Investors portfolio returned 6.7% compared with 1.3% for the S&P (with dividends reinvested). The value of a MoosePond share on 31 December was $15.398 compared with $14.404 at the end of 2010.
Our success for the year resulted in part from avoiding losses. We made some good defensive moves. Six of the seven stocks that we sold this year went down after we sold them. Two of them, Almost Family Inc. and Transocean Inc., lost about 50%. We replaced the stocks we sold by either buying new companies or adding to existing positions. In both cases we looked for quality stocks with strong projected 5-year return.
Our new positions in AFLAC, Apple, and Google have all done well. A performance report and summary of the current portfolio holdings at year end can be found here. We kept the portfolio well balanced and nearly fully invested all year.
As the brokers say, past performance does not guarantee future results. However, the methodology we have used over the past ten years seems to be working. We have found Manifest Investing to be particularly helpful in managing our portfolio. We rely on the projected average return and quality metrics in the dashboard view to quickly identity when to increase or decrease our holdings in a stock.
Happy New Year to all!
Moose Pond Investors has completed its tenth full year of operation. We have 19 partners made up of family and friends throughout the United States. Here is our Report to the Moose Pond Investors for 2010.
Portfolio Performance
In 2010, we had a total return of 14.4%. The S&P 500 was up 15.06% for the same period. If we had invested in the Vanguard S&P 500 index fund, VFINX, our return would have been 14.9%. The value of a unit increased from $12.659 to $14.404.
Over the past three years, Moose Pond has done significantly better than both the S&P 500 and the Russell 2000. Moose Pond’s annual return for the three-year period was 3.1%. In comparison, the S&P 500 was down 1.4% and the Russell 2000 was up only 2.2%. (The S&P is a large cap index and the Russell 2000 is a small cap index.) Our portfolio has both asset classes.
The annual returns for Moose Pond Investors are calculated using internal rate of return (IRR). This method is more precise because it looks at actual cash flows. It better accounts for partner investments and market fluctuations throughout the year. Calculating annual return using the change in unit value from year to year is a close approximation. (more…)