How Are We Doing?
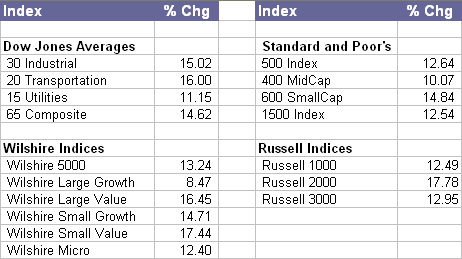
So how are we doing so far this year on return? The answer is OK, but not as well as we should be doing. We have an internal rate of return of 7.3% year to date. (Internal rate of return takes into account when we receive funds. It is a more accurate measure of performance.) 7.3% is in line with the Wilshire Large Growth Stock index which is up 8.5%. However, some of the broader market indices have done much better, such as the the Wilshire 5000 which reflects the total market, is up 13.2% for the year.
How we are doing depends on the index to which we compare our portfolio performance. Here is a table showing year to date return data taken from the Wall Street Journal as of Wednesday, November 22.

Note that value stocks and small stocks have out performed both large and growth stocks. This has been a trend for a number of recent years. If you want to compare investment returns by asset class (large, small, value growth, etc.) take a look at the Callan Periodic Table of Investment Returns.
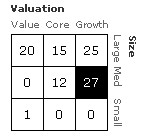
 As you can see from the matrix on the right, our portfolio is weighted heavily toward large growth stocks. It was only some recent purchases of GYI and VTI that improved our style balance. Large growth stocks have not done as well as the smaller stocks and the value stocks this year. We need to include more small and medium size companies in our portfolio. It may be inconsistent with an NAIC approach, but we also need some value stocks. Value stocks are generally defined as ones have lower price to earnings or low price to book ratios.
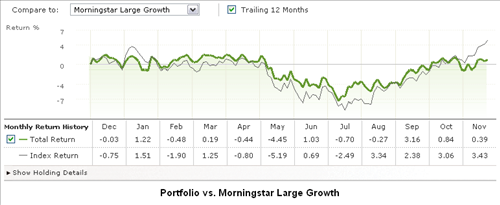
The next two graphs compare our portfolio return over the past 12 months with two Morningstar indices. The first graph compares our return to the Morningstar large growth index. Our return tracks that index fairly closely.

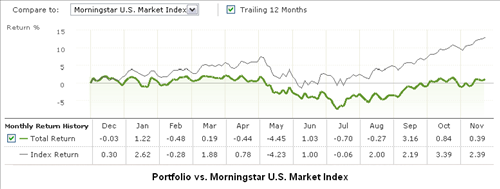
The second graph, below, compares our return with the Morningstar U.S. market index. This is a broad index that includes all stocks. We are not doing as well as that index.
