Deploying Available Cash
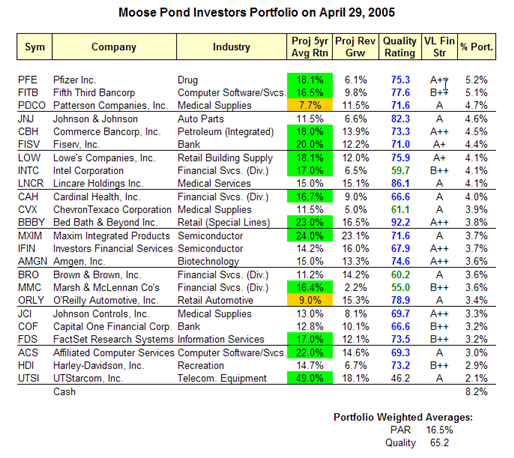
Here is our current portfolio sorted by the relative weight of our holdings. We are 8.2% in cash. We can purchase shares in an additional company and/or we can buy additional shares of companies we already own.
I’ll post the results of some recent screens showing quality and projected average return (PAR). Given the current market conditions, staying with quality stocks (e.g., quality rating > 65 and VL Financial Strength Rating >= B++) with high projected average return (e.g., PAR > 15%) seems like a good idea.
Evaluating Energy Stocks
Energy stocks are difficult to assess. The standard NAIC growth stock methodology does seem not work particularly well with energy companies since their revenues are driven in part by the pricing of the underlying commodity (oil or gas).
Kurt Wulff maintains the “McDeb” website which contains a weekly analysis of energy stocks. He was written up in Barrons earlier this year.
He has developed the McDep ratio which compares a company’s market value and debt to its present value. (“McDep” stands for market cap and debt to present value.) The ratio provides a useful way to compare energy companies and to assess relative market valuation.
In addition to preparing a weekly analysis called the “Meter Reader,” Kurt Wulff also profiles individual energy companies.
The site is free and does not require registration. The information on the site lags a week or two from when he provides it to his paying clients.
ChevronTexaco has a projected average return (PAR) of 10.4% and a quality rating of 64. More importantly, CVX has a McDep ratio of 0.77. This means that CVX is undervalued. A ratio of 1.0 would mean that ChevronTexaco’s market value and debt equaled its its present value. This McDep ratio calculation assumes $37 bbl oil. (This is a conservative assumption since futures contracts over the next six years are currently priced at $51 bbl.) See Wulff’s assessment of ChevronTexaco.
Financial Services Outlook
Here is an interesting article by Tom Brown, CEO of Second Curve Capital, discussing the outlook for 2005 for the financial services industry. The article notes that retail branch growth can’t go on indefinitely. The report is positive about Capital One (COF), Investors Financial Services (IFIN), Commerce Bancorp (CBH) and Morgan Stanley (MWD). (We hold three of these four stocks.) His website is www.bankstocks.com.
Evaluating Management
“Objective tests of managerial ability are few and rather unscientific. … The most convincing proof of capable management lies in a superior comparative record over a period of time….” – Graham and Dodd, Security Analysis
The attached file (933 kb) contains a presentation on Evaluating Company Managment given to the NAIC DC Chapter on October 30, 2004.
Section 2 of the NAIC stock selection guide (SSG) helps to evaluate how management is performing. It shows the key measures of management quality, pre-tax profits margins and return on equity for the past ten years. It also shows the trends for each of these (up, down or constant). The data in Section 2, when compared to the industry peers for a company, provides a good indicator if management effectiveness.
Pretax Profit Margin. Pre-tax profit margin represents how much of each sales dollar a company keeps before taxes. The SSG focuses on pre-tax profit margin rather than net profit margin because tax rates change from time to time. It is easier to compare pre-tax profit margins over a long period of time.
Look for consistency in pretax earnings, e.g., a consistent (flat) or upward trend that is above average for the industry. Be skeptical of above pre-tax profit margins that make a big jump. Consistent pre-tax profit margins might mean that a company has reached peak efficiency or it might mean that management has stopped improving efficiency. Do some additional research. See how the company’s pretax profit margins compare to its competitors.
Pre-tax profit margins can provide an early warning indicator of trouble. A decline in pre-tax profit margins often shows up in the income statement before earnings growth starts to decline. Both NAIC Investor Toolkit and Stock Analyst contain graphs that plot quarterly pre-tax profit margins and trailing twelve month pre-tax profit margins.
Return on Equity (ROE). ROE is a measure of how well a company has used reinvested earnings to generate additional earnings. ROE is a key financial factor in defining the growth potential of the company from internal sources.
ROE can be used to calculate the the “implied” or “sustainable growth rate” of a company. This is the potential earnings growth rate a company can maintain without borrowing. The calculation is simple, Return on Equity x Earnings Retention Rate. It usually better to a an average ROE (such as the 5-year average). The Earnings Retention Rate is how much the retains after taxes (1 – tax rate).
Barrons — Drug Industry
In an article this week, Barrons notes that the big drug stocks trade today for just 12 to 14 times projected 2004 profits. The last time the drug stocks saw valuations like these was in 1993-94 when Wall Street feared President Clinton’s health-care proposals would lead to industry price controls.
Pfizer and Merck are two of the stocks mentioned in the article. The consensus earnings projection for PFE over the next 12 months is $2.33. Using Friday’s closing price of $28.50, the forward PE is (28.50/2.33) or 12.2. PFE’s historical 10-year average PE is 32.6.
The consensus earnings projection for MRK over the next 12 months is $2.77. Using Friday’s closing price of $30.50, the forward PE is (30.50/2.77) or 11.0. MRK’s historical 10-year average PE is 22.6.
NAIC
The National Association of Investors Corporation (NAIC) teaches individuals how to become successful strategic long-term investors. NAIC investors use fundamental analysis to study common stocks and mutual funds. Information about NAIC and its investor resources can be found at http://www.better-investing.org. Volunters throughout the United States work with local chapters to teach individuals and clubs how to invest.
Unfortunately, NAIC has found itself at the center of a controversy and the subject of an investigation by the Finance Committee of the U.S. Senate. The core allegation is that the officers have abused the tax exempt of NAIC to enrich themselves at the expense of the members and the volunteers of the organization. A CNBC investigative report frames the issues. It remains to be seen whether the organization will remain viable as the controversy unfolds.

