Using Value Line for PAR
The Value Line Investment Analyzer software can be used to calculate both project average return or “PAR.” The following discussion of PAR builds on several ideas presented by Mark Robertson of Manifest Investing at a class to the Washington, D.C., chapter of NAIC this past April.
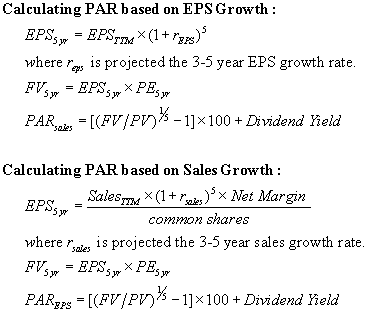
PAR can be calculated from Value Line data two ways. First, using the projected 3-5 year EPS growth rate the trailing 12-months EPS can be projected out for five years. Multiplying the Value Line projected 3-5 year average PE by the projected 5-yr EPS provides an estimated 5-yr price. PAR is the compound annual growth rate using the current stock price as the present value (PV) and the estimated 5-yr price as the future value (FV) and adding to it the dividend yield.
PAR also can be calculated by using projected 3-5 year sales growth. The trailing 12-months sales can be projected out for five years. Multiplying by the Value Line projected 3-5 year net margin and dividing by the protected total number of common shares results in an estimated 5-yr EPS. As with the above calculation, multiplying the Value Line projected 5-yr EPS by projected 3-5 year average PE the provides an estimated 5-yr price. PAR is the compound growth rate using the present value and the future value and adding to it the dividend yield.
Here are examples of the above calculations using the 04 Mar 2005 Value Line data sheet for Johnson & Johnson. The data sheet is annotated with an explanation of the sales growth determination. The following key numbers are taken from the data sheet.
From the growth projections on the left side of the data sheet:
Projected Sales growth = 9.5%
Projected EPS growth = 12.0%
From the quarterly data, get the trailing twelve months (TTM) for sales and EPS:
EPS TTM= 3.10
Sales TTM= 47,348
From the projections for ’08 – ’10:
Average Annual PE = 20
Net Profit Margin = 20.7%
Common Shares Outstanding = 2,800
From these numbers, we can calcute PAR. Assume the current price of $65.41 from the data sheet for these calculations.
Using 12% EPS growth:
EPS 5yr = EPS TMM * (1 + EPS growth rate)^5
EPS 5yr = 3.10 * (1.12)^5 = 5.46
FV (price) = EPS 5yr * Avg Annual PE
FV = 5.46 * 20 = 109.20
PAR = (FV / PV) ^ n
where period n is 5 years
PAR = (109.20/65.41)^(1/5) – 1 = 10.8%
Using 9.5% Sales growth:
Sales 5yr = Sales TMM * (1 + sales growth rate)^n
where period n is 5 years
Sales 5yr = 47348 * (1.095)^5 = 74537
EPS 5yr = 74537 * .207 / 2800 = 5.51
Once you have projected five year EPS, the calculation for PAR is the same as for EPS growth.
FV (price) = EPS 5yr * Avg Annual PE
FV = 5.51 * 20 = 110.20
PAR = (FV / PV) ^ n
where period n is 5 years
PAR = (110.20/65.41)^(1/5) – 1 = 11.0%
There are several ways to do these calculations. They can be done with a high school math calculator. Value Line Investment Analyzer allows the creation of user defined fields. The PAR calculations can be done in user defined fields. Alternatively, the Value Line data can be exported to a spreadsheet or data base and the calculations can be done there.
The advantage of calculating PAR is that it can combined with other parameters to screen the Value Line data base. For example, the attached screen is for all stocks in the Value Line 1,700 stock data base with a PAR of more than 15%, a Value Line Financial Quality Rating of B++ or better and an “RQR” quality ratings of 65 or higher. The screen yielded 61 stocks.
PAR is well suited for screening and for comparing stocks within a portfolio, especially when combined with a parameter that measures quality. It provides more consistent results and a better basis for comparison (than Total Return) — assuming that the future average annual PE is estimated in a consistent manner. It also allows for screening of stocks before doing an SSG. The PAR calculation in the SSG is simply based on the high and low PE assigned in Sections 4a and 4b, but that requires some judgment.
