Semi-Annual Report
For the first half of the year, our internal rate of return is +6.2% which is slightly ahead of the S&P 500 (+6.0%). See portfolio performance report for the first half of the year. Our challenge is to do much better than the S&P 500.
Portfolio Activity
We made some adjustments to our portfolio this quarter to improve portfolio quality and increase diversification. In the energy sector, we replaced Occidental Petroleum and ChevronTexaco with ConocoPhillips and Helmerich & Payne. This split our energy holdings between a mega-cap energy company that both produces and refines, and a quality company that provides contract drilling services to oil and gas producers.
In the financial sectors, we replaced Commerce Bank and Capital One Financial with American International Group. (There is nothing inherently wrong with CBH and COF, although COF has a low return on assets; we just wanted realign our financial stocks.) We exchanged East West Bancorp for Wells Fargo & Co.
We added to our position in Getty Images, Bed, Bath & Beyond, and Amgen. Unfortunately, BBBY reported mediocre earnings after we increased our position. This clipped our overall portfolio earnings for the quarter a little. See chart. However, BBBY remains a high quality company.
Finally, we added information technology holdings with new positions in Microsoft and SAP. We sold UTStarcom. All these transaction together raised the quality rating of the portfolio to 72.2 (out of 100 with 65 being excellent) and the projected average return to 13%.
Most Recent Quarter
Our biggest winners for the quarter were Intel (+24.7%), Maxim Integrated Products (+14.2%), and our energy stocks, Occidental Petroleum (+16.2%) and Chevron Texaco (+10.0%). We had several stocks that did not earn their keep this quarter, Bed, Bath & Beyond (-12.4%), Brown & Co. (-6.8%), Stryker (-4.9%), Synovus (-4.5%), and Walgreen (-5.0%).
The Past 12 Months
It is always interesting to look back over the past year. We had some outstanding winners,Stryker (+50.4%), Factset Research (+45.3%), Chevron Texaco (+34.1%), and Jack Henry & Assoc. (+32.2%). Two stocks disappointed, Amgen (-15.5%) and Brown & Co. (-13.3%).
Looking Forward
Not being a market prognosticator, I’ll leave it for others to predict where the stock market is heading. Morningstar had a very readable outlook, that included a sector by sector analysis. Morningstar observes that some of the mega-cap stocks, like Walmart and Johnson& Johnson are very cheap.
Projected Average Return and Quality
As individual investors, we need to stay focused on our portfolio and the individual stocks in it. Let’s take a look. The Manifest Investing dashboard provides some key information. The portfolio dashboard shows the quality and projected average return (PAR) for each stock and for the overall portfolio. For the portfolio, the quality rating is 72.2 out of 100, which is very good. High quality will give us some downside protection if the market is off for the second half of the year. The projected average return if 13.0%, also very good.
If you pay close attention to the portfolio dashboard, you will notice two stocks with low PARs, Factset Research (6.2%) and ConocoPhillips (4.3%). Factset Reasearch has had great performance, increasing 45.3% over the past year. So we are caught between two conflicting wall street adages: “Let your profits run” and “No one ever went broke taking a profit.”
Here is the stock selection guide (SSG) for Factset Research. You can see that it has had strong revenue and earnings growth. You also can see that it is selling near its all time high price. Value Line projects earnings and revenue growth of 16.5%. (We were more conservative than that in the SSG.) Morningstar estimates a fair market price of $64, making it fully valued at its current price; thus Morningstar gives Factset Research only 3 stars. Since Factset Research only makes up 4.3% of our portfolio, I am inclined to hold it as long as its fundamentals do not change. (Note: The risk of holding a growth stock with a high PE, like FDS, is that if earnings stumble, even for a quarter, the stock will sell off rapidly.)
ConocoPhillips (COP) also shows a low projected average return. Manifest Investing characterizes COP as a cyclical stock (hence the little squiggly symbol “~”). Manifest Investing uses Value Line data for its projections. Value Line assumes that long term oil prices will drop significantly. For example, Value Line projects only 2% revenue growth for ConocoPhillips. This low projection drives down the projected average return. I am not an analyst but Value Line seems to be unreasonably pessimistic about energy stocks.
For another view of ConocoPhillips see the McDep Associates stock report on COP from April. Kurt Wulff makes his energy news letters available on line. His weekly Meter Reader newsletter is very informative (and free). Also, see past Stockherd article about his methodology.
The bottom line is that holding some energy stocks provides needed diversification. COP pays a dividend of 1.6%. We should continue to hold it. The McDep ratio suggests it is significantly undervalued. Another reason to continue to hold it.
Portfolio Diversification
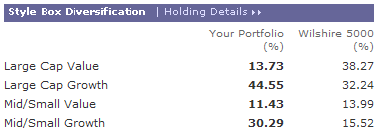
The Morningstar”X-Ray” report is helpful in looking at a portfolio as a whole. Here is a summary of the portfolio by asset class (which Morningstar calls styles):

The portfolio weighting is probably where we want it to be. It is split between large and mid/small cap stocks with large caps having a slightly higher weighting. Also, the portfolio tilts toward growth rather than value, which is expected with an NAIC/BI approach.
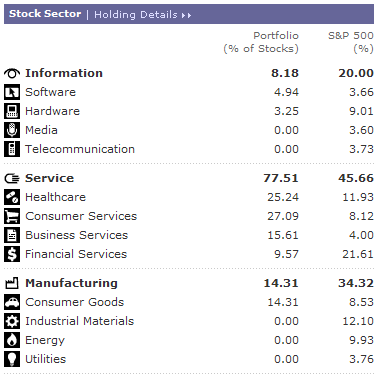
Here is a breakdown by sector and industry.

The portfolio is overweighted in the services sector and underweighted in the information technology and manufacturing sectors. As we replace stocks in the portfolio, we should look to the underweighted sectors for replacements.