NAIC Growth Fund
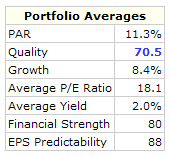
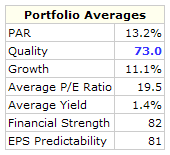
It is always helpful to compare portfolios. Here are summary dashboards for the NAIC Growth Fund and for the Moose Pond Investors portfolios. The NAIC Growth Fund is a closed end fund that was intended to demonstrate NAIC principles. You can click on either summary below for the complete dashboard.
In the past 6 months NAIC growth fund sold its position in Pepsi and Newell Rubbermaid. The fund added to its positions in Abbot Labs, Carlisle Companies, Jack Henry & Associates, Medtronic, Stryker, and Washington Mutual. The total return for the NAIC Growth Fund in 2005, based on change in net asset value, was 1.3% (slightly ahead of our return of 0.3).
| NAIC Growth Fund |
Moose Pond Investors |
 |
 |
While quality is about the same in both portfolios, the Moose Pond portfolio has higher PAR, higher projected growth, and a higher quality rating. We can probably improve the overall PAR by replacing several of our low PAR companies with higher PAR companies.
Morningstar Bellweather 50
Another list of stocks worthy of further study is the Morningstar Bellweather 50. This is a watch list of large-cap companies that Morningstar rates with a wide economic moat. Morningstar uses its star ratings to show relative valuations of these stocks. A rating of five stars mean the stock is undervalued. The link above shows projected average return and RQR quality rating for each of these stocks.
Portfolio Workshop
Here are the slides from the portfolio management class held by the D.C. Chapter of BetterInvesting. The slides are available in PowerPoint and Adobe PDF formats. Also, here are links to the Portfolio Record Keeper reports and the Excel spreadsheet discussed at the workshop.
The Coiled Spring Effect
Market forces are not always rational. Sometimes, a company continues to grow its earnings but its stock price gets stuck in a rut, trading within the same price range for several years. Earnings continue to grow but the price stays about the same. This phenomenon can be observed in the graph in Section 1 of the stock selection guide and also in the table in Section 3 (falling high and low PEs). Sooner or later, the market will “discover” the stock and the price will quickly adjust upward and then follow earnings more closely. Patient investors are rewarded. This is the coiled spring effect.
Three quality stocks that fall into this category are Wal-Mart Stores (WMT), Microsoft (MSFT) and the Coca-Cola Company (KO). They are discussed below. Moose Pond currently holds Wal-Mart.
Manifest Investing
Manifest Investing was founded by two NAIC members. Their web site uses Value Line data to estimate 5-yr projected average return and stock quality.
The Manifest Investing “dashboard” is very similar to our portfolio summary. In fact, we borrowed the idea from them of displaying PAR and quality as two of the primary metrics for portfolio management.
Sometimes you will find differences in the value of PAR shown on the Manifest Investing dashboard and our portfolio summary. We use the NAIC stock selection guide to calculate PAR. This requires the application of some judgment. In contrast, Manifest Investing uses a formula that applies Value Line data. Manifest Investing relies on the judgment of the Value Line analysts. Both appoaches are helpful. When there is a significant difference in PAR, we should try and understand why that has occurred.
The Manifest Investing dashboard updates automatically to reflect current stock prices. Our portfolio summary is updated monthly. You might find it helpful to review both. The dashboard link in the “About” section (upper left) will take you to the Manifest Investing dashboard for our portfolio.
PE Expansion & Contraction
When a stock appreciates in value, how much of that appreciation comes from earnings growth and how much comes from PE expansion? (Note: PE expansion occurs when buyers are willing to pay a higher price for the same amount of earnings. The price per share / earnings per share or “PE” ratio increases.)
Clearly, PE expansion was a major factor in the stock market gains that occurred between 1982 and 1999. Crestmont Research has an interesting chart on its web site that shows year end PEs for the S&P 500. The chart is arranged to show secular (long term) bull and bear markets.
Over the 17 year period from 1982 to 1999 (which Crestmont Research and others characterize as a bull market), the average PE for the S&P 500 rose from 7 to 42. At an annualized rate, the average PE increased 12.8%. This is a significant PE expansion for the market as a whole. For the 10-year period from 1989 to 1999, the average PE rose from 17 to 42, an annualized increase of 9.5%. And, for the 5-year period from 1994 to 1999, the average PE rose from 21 to 42, an annualized increase of 14.9%.
During these periods, any basket of stocks that generally had the characteristics of the S&P 500 would have increased significantly in value due to PE expansion alone. Earnings growth and overall market PE expansion together provided some impressive gains during the 1982-1999 period.
There is not much an individual investor can do about PE expansion or contraction. PE expansion and contraction are long term cyclical events that happen to the market as whole. Market PEs have been contracting for the last several years. The current PE for the S&P 500 is around 17. Declining high and low PEs since 1999 can be observed on the SSGs of many stocks.
What does this all mean for the average investors? First, PE expansion is something we can hope for but, like the weather, can’t do much about. Second, PE contraction seems more likely than PE expansion for the market over the next few years and possibly longer. Just look at the historical market PEs. Will the current market PE contraction stop at 17 or continue to 15, 12 or 7, and, if so, when will it stop? Third, the current market PE contraction makes achieving a 15% annualized return even more of a challenge.
Calculating Portfolio Return
There are a number of different ways to measure portfolio performance. Perhaps the most accurate method compares the annualized internal rate of return (IRR) for the portfolio with an index fund such as the Vanguard Index 500 Fund or the Vanguard Total Stock Market Fund. As we are using the term, IRR means the annualized rate of return for the portfolio taking into account the timing of all member investments and withdrawals. See answers.com for a more complete definition. Prior to the age of computerized spreadsheets, this calculation was somewhat tedious. (What ever happend to VisiCalc and SuperCalc?!)
A very clever spreadsheet created by a long term NAIC member does exactly that. (The Bivio website will generate a similar report called the performance benchmark.) Using data that shows the purchase and sale of member shares, the spreadsheet calculates the annualized internal rate of return for the club. It also calculates the annualized internal rate of return if the same funds had been invested in either the Vanguard Index 500 Fund or the Vanguard Total Stock Market Fund.
Here are the results comparing Moose Pond Investors with these two index funds for the period from 6 October 2000 to 5 August 2005:
- Moose Pond Investors -> 7.4%
- Vanguard Index 500 Fund -> 6.9%
- Vanguard Total Stock Market Fund -> 8.6%
Our return is line with these index funds. It also takes into account expenses such as brokerage fees and commissions. As we go forward, we hope to beat both indices. The spread sheet with the calculations for Moose Pond Investors is here.
Replace Any Stocks?
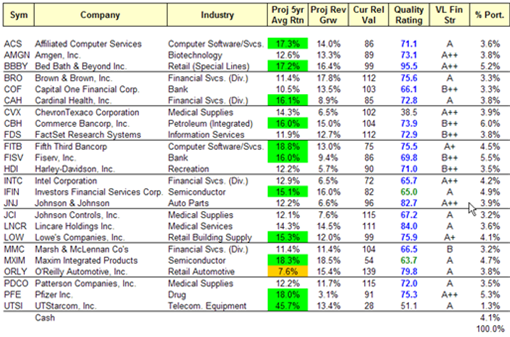
The portfolio summary on July 15 shows an overall projected average return of 14.8% and a quality rating is 71.9 (out of 100). This is excellent (in spite of the less than stellar YTD performance of the portfolio).
(Note the snapshot has changed since this entry. See current snapshot.)
In deciding what we might replace in our portfolio, we need to took at two things: projected average return (PAR) and the quality of each company. PAR is an estimate of the return we can expect if we hold the company for five years (assuming sales and earnings grow as predicted). Although the computer is very precise in its calculations, PAR is still an estimate — an intelligent guess. One or two percentage points difference in PAR between companies is relevant but we should not put too much weight on small differences.
In looking over the portfolio snapshot, we only have one stock with a PAR of less than 10% — ORLY. There is one important mathematical nuance when we calculate PAR. When a company lowers its long term earnings or revenue guidance (like IFIN and HDI), it is usually reflected in the price right away. The PAR calculation shows rate of growth from the present price to the estimated price in five years. This the lower present price causes PAR to increase. (For example, IFIN currently has PAR of 15.1% using 10% growth in EPS and revenue. The 15.1% PAR reflects that fact that price dropped 17% last week. It may also reflect some efficiency on the part of the market)
We also should give considerable weight to a company’s quality. “Quality” means a strong management team, consistent long term earnings and revenue growth, high return on shareholders’ equity (15-20% for at least 5 years), free cash flow, and what Warren Buffet would call a wide moat. We should be slow to sell a high quality stock. (The one exception to this is if the PAR falls below the risk free rate of return, e.g., the 5-year treasury rate or if there has been a negative change in a company’s fundamentals.) A quality company is more likely than a poor quality company to work through problems that might adversely impact future earnings. HDI is an example of high quality company with a strong management team.
As the PAR for a company drops falls below 10%, we need to take a close look at whether we want to continue to hold the company or replace it. I tend to hold high quality companies. However, if the PAR falls below the risk free rate of return or if there has been an adverse change in a company’s fundamentals the decision to sell is much easier.
We have more cash to invest. We can add to our existing holdings (ACS, BBBY, CAH, LOW and PFE all look good) or find a new company. Three watchlist companies that look interesting are Jack Henry (JKHY), Wal-Mart Stores (WMT) and Thomas Nelson, Inc. (TNM). As time permits this week, I’ll post SSGs and summaries for these three companies.
Evaluating Management
As Graham and Dodd note in their book, Security Analysis:
Objective tests of managerial ability are few and rather unscientific…. The most convincing proof of capable management lies in a superior comparative record over a period of time….
Sections I and II of the stock selection guide provide tools for evaluating the performance of company management over a ten year period. Section I provides a visual representation of revenues, earnings and pretax profit that shows growth and consistency. Section II shows pretax profit margins and return on equity for the same period. Together, these metrics provide a good indicator of the long term results achieved by management.
Here is a presentation from the DC Chapter of NAIC on Evaluating Company Management. The presentation also discusses calculation of the “Robertson Quality Rating.”
[PowerPoint version of the NAIC DC Chapter presentation on May 7, 2005.]
Using Value Line for PAR
The Value Line Investment Analyzer software can be used to calculate both project average return or “PAR.” The following discussion of PAR builds on several ideas presented by Mark Robertson of Manifest Investing at a class to the Washington, D.C., chapter of NAIC this past April.
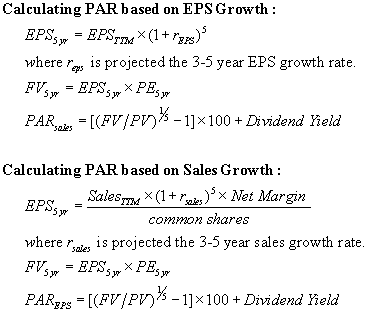
PAR can be calculated from Value Line data two ways. First, using the projected 3-5 year EPS growth rate the trailing 12-months EPS can be projected out for five years. Multiplying the Value Line projected 3-5 year average PE by the projected 5-yr EPS provides an estimated 5-yr price. PAR is the compound annual growth rate using the current stock price as the present value (PV) and the estimated 5-yr price as the future value (FV) and adding to it the dividend yield.
PAR also can be calculated by using projected 3-5 year sales growth. The trailing 12-months sales can be projected out for five years. Multiplying by the Value Line projected 3-5 year net margin and dividing by the protected total number of common shares results in an estimated 5-yr EPS. As with the above calculation, multiplying the Value Line projected 5-yr EPS by projected 3-5 year average PE the provides an estimated 5-yr price. PAR is the compound growth rate using the present value and the future value and adding to it the dividend yield.
Here are examples of the above calculations using the 04 Mar 2005 Value Line data sheet for Johnson & Johnson. The data sheet is annotated with an explanation of the sales growth determination. The following key numbers are taken from the data sheet.
From the growth projections on the left side of the data sheet:
Projected Sales growth = 9.5%
Projected EPS growth = 12.0%
From the quarterly data, get the trailing twelve months (TTM) for sales and EPS:
EPS TTM= 3.10
Sales TTM= 47,348
From the projections for ’08 – ’10:
Average Annual PE = 20
Net Profit Margin = 20.7%
Common Shares Outstanding = 2,800
From these numbers, we can calcute PAR. Assume the current price of $65.41 from the data sheet for these calculations.
Using 12% EPS growth:
EPS 5yr = EPS TMM * (1 + EPS growth rate)^5
EPS 5yr = 3.10 * (1.12)^5 = 5.46
FV (price) = EPS 5yr * Avg Annual PE
FV = 5.46 * 20 = 109.20
PAR = (FV / PV) ^ n
where period n is 5 years
PAR = (109.20/65.41)^(1/5) – 1 = 10.8%
Using 9.5% Sales growth:
Sales 5yr = Sales TMM * (1 + sales growth rate)^n
where period n is 5 years
Sales 5yr = 47348 * (1.095)^5 = 74537
EPS 5yr = 74537 * .207 / 2800 = 5.51
Once you have projected five year EPS, the calculation for PAR is the same as for EPS growth.
FV (price) = EPS 5yr * Avg Annual PE
FV = 5.51 * 20 = 110.20
PAR = (FV / PV) ^ n
where period n is 5 years
PAR = (110.20/65.41)^(1/5) – 1 = 11.0%
There are several ways to do these calculations. They can be done with a high school math calculator. Value Line Investment Analyzer allows the creation of user defined fields. The PAR calculations can be done in user defined fields. Alternatively, the Value Line data can be exported to a spreadsheet or data base and the calculations can be done there.
The advantage of calculating PAR is that it can combined with other parameters to screen the Value Line data base. For example, the attached screen is for all stocks in the Value Line 1,700 stock data base with a PAR of more than 15%, a Value Line Financial Quality Rating of B++ or better and an “RQR” quality ratings of 65 or higher. The screen yielded 61 stocks.
PAR is well suited for screening and for comparing stocks within a portfolio, especially when combined with a parameter that measures quality. It provides more consistent results and a better basis for comparison (than Total Return) — assuming that the future average annual PE is estimated in a consistent manner. It also allows for screening of stocks before doing an SSG. The PAR calculation in the SSG is simply based on the high and low PE assigned in Sections 4a and 4b, but that requires some judgment.

