Deploying Available Cash
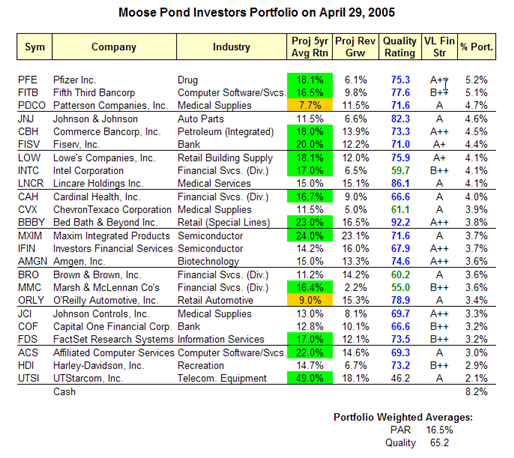
Here is our current portfolio sorted by the relative weight of our holdings. We are 8.2% in cash. We can purchase shares in an additional company and/or we can buy additional shares of companies we already own.
I’ll post the results of some recent screens showing quality and projected average return (PAR). Given the current market conditions, staying with quality stocks (e.g., quality rating > 65 and VL Financial Strength Rating >= B++) with high projected average return (e.g., PAR > 15%) seems like a good idea.
Quality Growth Screen
Here is a Quality Growth Screen using Value Line data. Projected average return was calculated from Value Line data in two ways One calulation sued projected EPS growth, the other used projected sales growth.
Evaluating Energy Stocks
Energy stocks are difficult to assess. The standard NAIC growth stock methodology does seem not work particularly well with energy companies since their revenues are driven in part by the pricing of the underlying commodity (oil or gas).
Kurt Wulff maintains the “McDeb” website which contains a weekly analysis of energy stocks. He was written up in Barrons earlier this year.
He has developed the McDep ratio which compares a company’s market value and debt to its present value. (“McDep” stands for market cap and debt to present value.) The ratio provides a useful way to compare energy companies and to assess relative market valuation.
In addition to preparing a weekly analysis called the “Meter Reader,” Kurt Wulff also profiles individual energy companies.
The site is free and does not require registration. The information on the site lags a week or two from when he provides it to his paying clients.
ChevronTexaco has a projected average return (PAR) of 10.4% and a quality rating of 64. More importantly, CVX has a McDep ratio of 0.77. This means that CVX is undervalued. A ratio of 1.0 would mean that ChevronTexaco’s market value and debt equaled its its present value. This McDep ratio calculation assumes $37 bbl oil. (This is a conservative assumption since futures contracts over the next six years are currently priced at $51 bbl.) See Wulff’s assessment of ChevronTexaco.
FactSet Research Sys (FDS)
SSG and PERT A | Google Stocks | Company Website
 5/7/2007: The SSG has been updated. FDS has been a winner. However, its run-up in price has reduced projected average return (PAR) to about 6%. If PAR falls any lower, it might be candiate for replacement. ValueLine rates its financial strength B++ and earnings predictability 100. Morningstar rates it three stars. See stock selection guide. (more…)
Cardinal Health Inc. (CAH)
SSG and PERT A (04-23-2005) | Google Stocks | Company Website
 This is an update of the SSG for Cardinal Health. CAH is a buy.
(more…)
Teva Pharmaceutical Ind.
The April 2005 Better Investing magazine featured Teva Pharmaceutical Industries as a stock to study. Here is a PowerPoint presentation and stock selection guide analyzing Teva.
Here is the bottom Line: TEVA is a good quality stock. Value Line financial strength is A but earnings predictability is only 55, RQR is 58.5. It currently has an upside/downside ratio of 4.3 and a relative value is 106. It has an estimated total return of 20.4% (assuming a 5-yr high PE of 24.8) and projected average return of 16.0%.
