2013 is behind us. It was an excellent year for stocks. Our portfolio had a total return of 30.1%. We had mostly gainers, including SYNT (+68.5%), CRR (+68.5%), GOOG (58.3%), CSX (+49.1%), and MSFT (+44.1%). Of the stocks we kept in our portfolio, we only had one loser, BRLI (-10.8%).
When we started Moose Pond Investors in October 2000, a share was worth $10.00. Today, a share is worth $23.719. Our annualized internal rate of return from October 2000 to now is 9.1%. The S&P 500, with dividends reinvested, had an internal rate of return of 8.4% for the same period.
Let’s go forward with reasonable expectations for 2014. It is most unlikely — almost certain — that we will not see the same gains in 2014 that we saw in 2013 or even 2012. Markets always revert to the mean. A downward correction in 2014 is possible. (Remember, a reasonable long term expectation for total stock market return is about 8% per year.)
We will continue to do what we have done for 13 years, look for quality growth companies that are reasonably valued. We will stay close to fully invested in equities. One of the keys to success in investing is to view down markets as a buying opportunity and to remain fully invested. There are probably people who can time the market, I have just not found any in more than 40 years of investing.
We wish everyone happy and prosperous New Year.
Overall we had a good year. The Moose Pond Investors portfolio returned 6.7% compared with 1.3% for the S&P (with dividends reinvested). The value of a MoosePond share on 31 December was $15.398 compared with $14.404 at the end of 2010.
Our success for the year resulted in part from avoiding losses. We made some good defensive moves. Six of the seven stocks that we sold this year went down after we sold them. Two of them, Almost Family Inc. and Transocean Inc., lost about 50%. We replaced the stocks we sold by either buying new companies or adding to existing positions. In both cases we looked for quality stocks with strong projected 5-year return.
Our new positions in AFLAC, Apple, and Google have all done well. A performance report and summary of the current portfolio holdings at year end can be found here. We kept the portfolio well balanced and nearly fully invested all year.
As the brokers say, past performance does not guarantee future results. However, the methodology we have used over the past ten years seems to be working. We have found Manifest Investing to be particularly helpful in managing our portfolio. We rely on the projected average return and quality metrics in the dashboard view to quickly identity when to increase or decrease our holdings in a stock.
Happy New Year to all!
Moose Pond Investors has completed its tenth full year of operation. We have 19 partners made up of family and friends throughout the United States. Here is our Report to the Moose Pond Investors for 2010.
Portfolio Performance
In 2010, we had a total return of 14.4%. The S&P 500 was up 15.06% for the same period. If we had invested in the Vanguard S&P 500 index fund, VFINX, our return would have been 14.9%. The value of a unit increased from $12.659 to $14.404.
Over the past three years, Moose Pond has done significantly better than both the S&P 500 and the Russell 2000. Moose Pond’s annual return for the three-year period was 3.1%. In comparison, the S&P 500 was down 1.4% and the Russell 2000 was up only 2.2%. (The S&P is a large cap index and the Russell 2000 is a small cap index.) Our portfolio has both asset classes.
The annual returns for Moose Pond Investors are calculated using internal rate of return (IRR). This method is more precise because it looks at actual cash flows. It better accounts for partner investments and market fluctuations throughout the year. Calculating annual return using the change in unit value from year to year is a close approximation. (more…)
As we head into the fall season, the equity market has improved significantly from its bleak lows in March. However, even though we are beating the S&P 500 (an index of large caps stocks) our portfolio has not fully recovered. Year-to-date, we are up 17.4% compared to 15.1% for the S&P500.
There are several tools, some of which were developed by NAIC / BetterInvesting for looking at an entire portfolio. The portfolio evaluation review technique or “PERT” takes data from individual stock selection guides and creates a table. Sorting this information allows identification of the outliers.
PERT Report. Here is the PERT Report for the Mose Pond Investors portfolio. This report is sorted on estimated total return, lowest to highest. Looking at the low end, several companies in our portfolio stand out as being candidates for replacement, e.g., AIG, Helmerich & Payne (HP), and Illinois Tools Works (ITW).
Before making any decisions based on the PERT report, it is important to understand how Toolkit 6 calculates total % return. The PERT report uses the estimated earnings per share (EPS) for the next 12 months and extends those earnings for four more years (for a total of five years) using the EPS growth rate from section 1 of the SSG. The 5-year estimated EPS is multiplied by the estimated future PE (which is the average of the high and low PE from section 4 of the stock selection guide). This give an expended price in five years. 5-year price appreciation then is a simple calculation — [(Future Price / Present Price) ^ (1/5)] – 1.
The total return is the the sum of the price appreciation in percent and the average dividend payout in percent. This may sound complicated, but it is not. The total return calculation depends on the accuracy of the 12 month projected EPS, the applied 5-year EPS growth rate and the estimated future PE. Despite the wonderful precision of the software, PAR is just a reasoned guess based on three independent variables.
The return on any stock is a function of only three variables: earnings, dividends, and valuation (i.e., the price to earnings ratio). When we try to predict earnings or PE ratios five years into the future, we must use judgment and we are often wrong. That is why we revisit our judgment each quarter as companies publish new earnings reports.
Trend Report. This Trend Report looks at the trend of the operations of the companies in the portfolio over two consecutive quarters relative to earnings, sales, and pre-tax profit in order to view the “trend of the trends.” The report also includes total return (as described above) and projected average return or PAR.
Projected average return or PAR is calculated in a manner similar to similar to total return except that we use Section 1 of the stock section guide rather than the analysts 12-month estimates for future EPS. There are several different techniques for estimating future EPS, but projected average return or PAR is based largely on the 5-year estimated EPS in Section 1 of the SSG. The total return and PAR sometimes differ. This simple reflects the different approaches to calculating 5-year EPS.
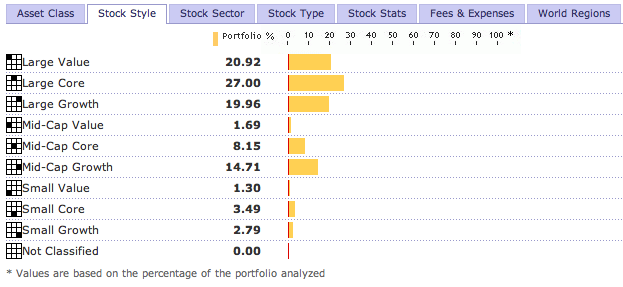
Portfolio Allocation. It is important to understand how what asset classes are included in a portfolio. For U.S. equities, we generally characterize a stock as small, medium, or large based either ion market capitalization or total revenue. We also use fundamental analysis to characterize a stock a growth, value, or in between. In a globalized economy, it is helpful to know the extent to which a company’s revenue come from outside the U.S.
Academic studies have show that small cap stocks out perform large cap stocks over time. Similarly, value stocks tend to slightly out perform growth stocks over long periods. Also diversifying a portfolio over multiple asset classes tends to reduce risk and improve ove7rall performance.
Morningstar provides an excellent “X-Ray” tool for looking at the style and sector characteristics of a portfolio. Here are the X-Ray summaries for the Mose Pond Investors portfolio by style and sector. These reports suggest that the portfolio may be overweighted to large cap stocks.
As if all these views of our portfolio were no confusing enough, there is one more. The Manifest Investing portfolio dashboard is helpful. It shows quality and PAR for the portfolio. For the reasons discussed above, our calculation of PAR may not agree with those on Manifest Investing. However, the portfolio dashboard does provide an easy way to find outliers which require more analysis. The portfolio dashboard also provides any easy why to decide where to apply additional case (i.e., those companies with high quality and high PAR that reflect a small percentage of the overall portfolio. Conversely, the portfolio dashboard can be used to find stocks to replace (i.e., those with low PAR or quality that reflect a large percentage of the portfolio.
Like the fighter who says “if you think I look bad, you should see the other guy,” a few hard blows have landed on the Moose Pond portfolio but we are still ahead of the broad market indices this year by slightly more than 10%.
Using the performance benchmark report in Bivio, the internal rate of return for the Moose Pond portfolio was a negative 27.6% year-to-date on October 31. In comparison, the Vanguard Total Market Index Fund was down 38.6% and the Vanguard S&P 500 index Fund was down 38.5% for the same 10-month period.
It will take a strong post-election rally to take the edge off the losses for this year. Stock valuations are at a low for several decades. So while there has to be pony in here somewhere, no one can be sure exactly when we’ll find it. In the interim, we should continue to follow out investment objectives and remain fully invested and commit new cash.
We do have an opportunity to replace several of our stocks with ones that have a higher projected average for the next five years. More to follow on that.
Here are performance reports for the one month and 12 month periods ending on October 31, 2008.
Despite the tumultuous week on Wall Street, our portfolio weathered the storm. Since the beginning of the of the year, the value of a unit share in Moose Pond Investors declined about 2% from $13.647 to $13.375. However, the overall stock market declined 13.1% for the same period (using the Wilshire 5000 index). Our internal rate of return, which takes into account all cash flows for the portfolio, for the same period is -2.5%. Here is a detailed YTD performance report.
AIG was the big loser, dropping 93%. The stock is probably a lost cause. Good thing we didn’t but any more! The other contributors to our losses this year were Synovus Financial (-50.8%), Total System Services (-35.2%), Microsoft -28.5%), and Intel (-26.5%).
An astute reader of this blog pointed out that most of the drop in price for Synovus Financial (-50.8%) this year was a result of the spin-off of TSS in January. That’s exactly correct. Just looking at the price of SNV does not tell the whole story.  At the beginning of the year, our holdings in SNV had a value of $1,758. SNV and TSS currently have a combined value of $1,392. So the actual decline in value this year is only 20.8%.
But for the losses on AIG and TSS, we would have been in positive territory for 2008.
We do have some winners this year. They include Helmerich & Payne (+40.3). Wells Fargo & Co. (+36.2%), Amgen (+29.1%), Sun Hydraulics (+26.4%), and Lowes (+26.3%). This underscores the importance of diversification and quality in a portfolio.
Take a look at the portfolio dashboard from Manifest Investing. We may want to consider selling Bed, Bath & Beyond and Brown & Brown. At the same time, we may want to slightly increase our holdings in Microsoft, Walgreen, Transoceanic, and FactSet Research. Each of these companies have a high quality rating and high projected average return.
As of this past Friday, we survived the market turmoil. The internal rate of return for Moose Pond Investors was 2.4% for the year to date. This slightly lagged the S&P 500, which was up 4.3% for the same period. See performance report.
Several stocks accounted for the mediocre performance.
Getty Images GYI (-38%) had a disappointing quarterly earnings report. Morningstar star reduced its fair market value estimate. Investors Advisory service recommends selling GYI, noting that the company faces increased competition in the Internet photo images market. Morningstar reduced GYI’s moat rating from “wide” to “narrow.” The visual section of the stock selection guide show the downturn. See the current stock selection guide (SSG) which shows a projected average return (PAR) of only 7.6%. My bad for recommending this one. We should probably sell GYI at some point soon.
Amgen AMGN (-26.6%) has been down for the year. However, most of the analyst reports cite its pipeline and consider it a strong long term buy. Here is the current AMGN SSG. Note that the PAR of 22.7% and that assumes a relatively modest EPS growth of 11%. AMGN is definitely a hold and probably a buy. Now if the market will just recognize what we do!
Of course we had several winners YTD as well. These include INTC (+23.7%), ITW (+24.9%), JKHY (+25.2%), and OXY (+27.8%). This highlights the importance of diversification.
Here are three transactions that may improve our portfolio performance for this year.
For the first half of the year, our internal rate of return is +6.2% which is slightly ahead of the S&P 500 (+6.0%). See portfolio performance report for the first half of the year. Our challenge is to do much better than the S&P 500.
Portfolio Activity
We made some adjustments to our portfolio this quarter to improve portfolio quality and increase diversification. In the energy sector, we replaced Occidental Petroleum and ChevronTexaco with ConocoPhillips and Helmerich & Payne. This split our energy holdings between a mega-cap energy company that both produces and refines, and a quality company that provides contract drilling services to oil and gas producers.
In the financial sectors, we replaced Commerce Bank and Capital One Financial with American International Group. (There is nothing inherently wrong with CBH and COF, although COF has a low return on assets; we just wanted realign our financial stocks.) We exchanged East West Bancorp for Wells Fargo & Co.
We added to our position in Getty Images, Bed, Bath & Beyond, and Amgen. Unfortunately, BBBY reported mediocre earnings after we increased our position. This clipped our overall portfolio earnings for the quarter a little. See chart. However, BBBY remains a high quality company.
Finally, we added information technology holdings with new positions in Microsoft and SAP. We sold UTStarcom. All these transaction together raised the quality rating of the portfolio to 72.2 (out of 100 with 65 being excellent) and the projected average return to 13%.
Most Recent Quarter
Our biggest winners for the quarter were Intel (+24.7%), Maxim Integrated Products (+14.2%), and our energy stocks, Occidental Petroleum (+16.2%) and Chevron Texaco (+10.0%). We had several stocks that did not earn their keep this quarter, Bed, Bath & Beyond (-12.4%), Brown & Co. (-6.8%), Stryker (-4.9%), Synovus (-4.5%), and Walgreen (-5.0%).
The Past 12 Months
It is always interesting to look back over the past year. We had some outstanding winners,Stryker (+50.4%), Factset Research (+45.3%), Chevron Texaco (+34.1%), and Jack Henry & Assoc. (+32.2%). Two stocks disappointed, Amgen (-15.5%) and Brown & Co. (-13.3%).
Looking Forward
Not being a market prognosticator, I’ll leave it for others to predict where the stock market is heading. Morningstar had a very readable outlook, that included a sector by sector analysis. Morningstar observes that some of the mega-cap stocks, like Walmart and Johnson& Johnson are very cheap.
For the quarter ending March 30, the Moose Pond portfolio increased in value by 2.9%. In comparison, the S&P 500 increased 0.18% for the same period. See the portfolio performance report for the quarter.
The top five advancers for the quarter were SYK (+20.8%), IFIN (+16.9%), GYI (+13.6%).,CAH (+13.4%), and JKHY (+12.7%). The laggards were AMGN (-18.2%), JNJ (-8.4%), INTC (-5.0%), CBH (-5.0), and BRO (-3.9).
Other than normal dividend reinvestment activity, we bought WAG and added to our position in JNJ. We bought more Vanguard total stock market index (an exchange traded fund) as a holding place for funds available to invest. We sold UTSI and IFIN. (IFIN was acquired by another company.)
For the month of January, the Moose Pond portfolio is up 3.6% (in comparison with 1.4% for the S&P 500). We may be back on track. As of today, Feb 2, the portfolio return is up 4.5%, compared with 1.95% for the S&P 500. That is good news!
This month we sold UTStarcom (UTSI) for a loss of $717 and Investors Financial (IFIN) for gain $199. We are 6.8% in cash. We will be using some of that cash to round out our holdings of Walgreens (WAG) and will park the rest in the Vanguard Total Market Index (VTI).
Getty Images really took off this month, up 15%. They did better than the analysts expected. We are back in the black for that stock.
We have two stocks that have doubled since we bought them. Lowes (LOW), one of our first stocks, is up 248% for an annualized return of 22.4%. Factset Research Service (FDS) is up 123% for an annualized return of 32.3%. We need a few more stocks like them.
You can see the entire portfolio at Manifest Investing.