We still consider Almost Family to be a buy. Â See stock selection guide below.
SSG – 31 Dec 2010 Company Website
Purchased 62.937 shares on 11 October 2010 for $1,997 @ $31.73
On July 29, we purchased:
We sold 27 shares of Helmerich & Payne Inc (HP), a gas and drilling company, at $57.27 reducing the weight of this holding to 2.9%. Transocean, a deep sea oil and gas drilling company,
On July 30, we purchased an additional 15.682 shares of Garmin at $39.250. Garmin took quite a beating last week when it reduced its 2008 earnings guidance from $4.40 to $4.13 per share. Garmin also reduced its revenue guidance from $4.5 billion to $3.9 billion. It appears that the bad news is more than reflected in the current stock price of $33.64.
A stock selection guide (SSG) for Garmin can be found here. This SSG assumes a reduced revenue growth of 12% and a reduced pre-tax profit marin in five years. The SSG assumes a future P/E of 15 (current P/E is 8). The projected average return is 23.1%.
If the current high price of crude oil reflects a fundamental change in the world-wide demand for oil, as many suggest (see Sunday Washington Post article), then prospects may be bright for oil services stocks. We have one oil services stock in our portfolio, Helmerich & Payne (HP). The stock is at $52.90 per share, up from the $33.72 we paid for it last June. HP is 6.8% of our portfolio. HP provides contract drilling services to oil and gas producers primarily in the United States, Argentina, Colombia, Ecuador, and Venezuela.
It might be wise to diversify and include deep water drilling company. Transocean Inc. (RIG) pops up in numerous screens and articles. Value Line describes Transocean as the world’s largest offshore drilling contractor, working in all the major offshore regions, including the Gulf of Mexico, the North Sea, the Middle East, and off the coasts of West Africa, the United Kingdom, Norway, Brazil, and Canada. It specializes in technically demanding deep-water/harsh-environment drilling projects.
Here is a stock selection guide for Transocean. Manifest Investing estimates a projected average return of 19.3%. Morningstar rates Transocean 5-stars (undervalued) and calculates fair vale as $176 (current price is $133). We should consider selling part of our position in HP and buying RIG.
One of the excellent companies that caught in the market downdraft last week is Sun Hydraulics (SNHY). It is a small industrial company in Sarasota, Florida, that designs and manufacturers screw-in hydraulic cartridge valves and manifolds, which control force, speed and motion as integral components in fluid power systems.
SNHY has a global network with 53% of its sales overseas. It is not dependent on any one customer, with its largest customer accounting for 7% of revenues. Insiders hold hold 32% of the shares. If you listen to its last quarter earnings conference (found on the company website), you get a sense of a well managed company with a closely knit team.
Analysts predict 20% EPS growth. We assumed 18% growth in the stock selection guide and used conservative PEs. Manifest Investing rates the quality 79.9 and projected average return 19.9%. The PE to growth (PEG) ratio is approximately 1. With $149 million in revenue for the TTM, this company has room to grow. Propose we buy this company now.
SSG and PERT | Google Finance | Company Website
 We purchased an initial position in SAP AG on June 13, 2007. Here is the stock selection guide we used for the purchase decision.
SSG and PERT | Google Finance | Company Website
 We purchased an initial position in American International Group on June 13, 2007. This replaces Capital One Financial in the financial sector of our portfolio. Here is the stock selection guide we used for the purchase decision.
SSG and PERT | Google Stocks | Company Website

We sold our position in GYI on August 28, 2007. The price was $31.04. The reason for selling was declining earnings prospects. GYI is facing stiff competition from other sellers of image.
We purchased an initial position in Getty Images on November 22, 2006. Here is the stock selection guide we used for the purchase decision.
Affiliated Computer Services (ACS)
SSG and PERT A (12-26-2005) | Google “Stocks: ACS” | Company Website
![]()
We sold Affiliated Computer Systems on November 11, 2006 at $29.74. We had a long term gain of $13. We originally purchased ACS in November 2003.
Rationale for sale: ACS seems unable to move forward. Click here for a SSG. As the chart below shows, it seem it has been unable to grow its revenue and earnings in any significant way over the past 4-5 quarters. It is now mired in an options pricing mess and will have to restate its earnings. ACS failed to fully report its current quarter and instead offered up instead “non-GAAP” (GAAP = generally accepted accounting principles) metrics of performance. Its TTM pre-tax margin (10.5%) is below the industry average (15.8%). Morningstar still rates ACS 4-stars but also rates it F for stewardship.
SSG and PERT A Graph | Google “stocks: mmc” | Company Website
We sold Marsh & McClennan on November 11 at $32.01. This gave us a long term capital gain of $143.18. We had originally purchased MMC in November 2004.
Rationale for the sale: MMC has not yet recovered from its myriad of regulatory problems. Click here for a SSG. It has failed to re-establish growth in either revenues or earnings. Return on equity and pretax margins have dipped significantly, with no immediate sign of recovery. It may be a good value stock (Morningstar rates it 4-stars) but it currently fails as a quality growth stock. We have replaced it with GYI and WAG.
SSG and PERT | Google Stocks | Company Website

Maxim reported earnings for the fiscal year ending June 24, 2006. The company reported revenue growth of 11.2%. However, net income fell (-14.4%)and diluted EPS fell (14.9%) from $1.578 to $1.372. See Maxim’s press release. The expensing of stock based compensation contributed to the poor earnings.
Maxim and Linear Technologies (LLTC) are similar companies with different niches in the semiconducter industry. They had similar results this year, increased revenue growth but declining earnings. LLTC’s EPS did not decline as much as that of MXIM.
Should we sell MXIM? The short answer is no. The company’s fundamentals — the basis on which we buy or hold stocks — still look very good. On Friday, Maxim reported record-high quarterly revenue as bookings. The company has no long term debt. Net profit margins have remained strong. Value Line projects 20% sales growth and 15.5% earnings growth. The analysts consensus for 5-year earnings growth rate is 20%. Morningstar gives Maxim a 5-start rating (meaning it is priced well below fair value), a wide moat, and a stewardship grade of B. Manifest Investing rates its quality 69.
Whenever the earnings of a growth company falter, the price of the stock usually tumbles. Maxim’s stock price is near its three year low even though the company’s fundamentals and business model appear to be intact.
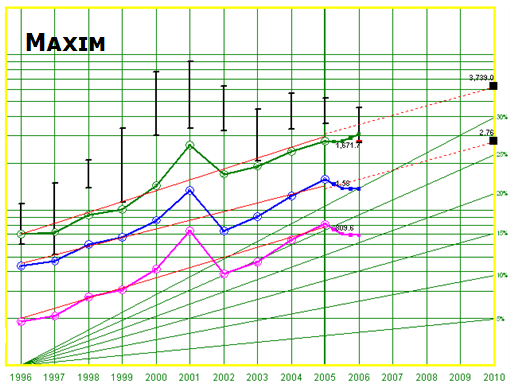
We currently hold 58 shares of Maxim valued at $2,090. It is 4.3% of our portfolio. Our average cost is $35.88 per share. The current share price is $27.94. We have a net loss of $462. (We also have a net loss for Intel, another semiconductor stock.) Revising the stock selection guide for a projected 15% EPS growth, projected average return is 21.5%. At his point, we probably have more to gain than lose by holding Maxim.
(more…)