Evaluating Management
As Graham and Dodd note in their book, Security Analysis:
Objective tests of managerial ability are few and rather unscientific…. The most convincing proof of capable management lies in a superior comparative record over a period of time….
Sections I and II of the stock selection guide provide tools for evaluating the performance of company management over a ten year period. Section I provides a visual representation of revenues, earnings and pretax profit that shows growth and consistency. Section II shows pretax profit margins and return on equity for the same period. Together, these metrics provide a good indicator of the long term results achieved by management.
Here is a presentation from the DC Chapter of NAIC on Evaluating Company Management. The presentation also discusses calculation of the “Robertson Quality Rating.”
[PowerPoint version of the NAIC DC Chapter presentation on May 7, 2005.]
Using Value Line for PAR
The Value Line Investment Analyzer software can be used to calculate both project average return or “PAR.” The following discussion of PAR builds on several ideas presented by Mark Robertson of Manifest Investing at a class to the Washington, D.C., chapter of NAIC this past April.
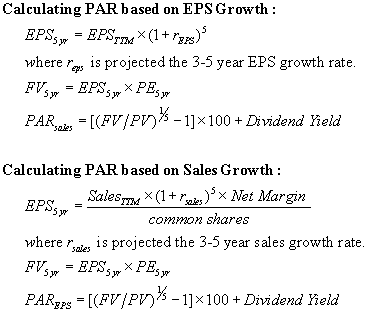
PAR can be calculated from Value Line data two ways. First, using the projected 3-5 year EPS growth rate the trailing 12-months EPS can be projected out for five years. Multiplying the Value Line projected 3-5 year average PE by the projected 5-yr EPS provides an estimated 5-yr price. PAR is the compound annual growth rate using the current stock price as the present value (PV) and the estimated 5-yr price as the future value (FV) and adding to it the dividend yield.
PAR also can be calculated by using projected 3-5 year sales growth. The trailing 12-months sales can be projected out for five years. Multiplying by the Value Line projected 3-5 year net margin and dividing by the protected total number of common shares results in an estimated 5-yr EPS. As with the above calculation, multiplying the Value Line projected 5-yr EPS by projected 3-5 year average PE the provides an estimated 5-yr price. PAR is the compound growth rate using the present value and the future value and adding to it the dividend yield.
Here are examples of the above calculations using the 04 Mar 2005 Value Line data sheet for Johnson & Johnson. The data sheet is annotated with an explanation of the sales growth determination. The following key numbers are taken from the data sheet.
From the growth projections on the left side of the data sheet:
Projected Sales growth = 9.5%
Projected EPS growth = 12.0%
From the quarterly data, get the trailing twelve months (TTM) for sales and EPS:
EPS TTM= 3.10
Sales TTM= 47,348
From the projections for ’08 – ’10:
Average Annual PE = 20
Net Profit Margin = 20.7%
Common Shares Outstanding = 2,800
From these numbers, we can calcute PAR. Assume the current price of $65.41 from the data sheet for these calculations.
Using 12% EPS growth:
EPS 5yr = EPS TMM * (1 + EPS growth rate)^5
EPS 5yr = 3.10 * (1.12)^5 = 5.46
FV (price) = EPS 5yr * Avg Annual PE
FV = 5.46 * 20 = 109.20
PAR = (FV / PV) ^ n
where period n is 5 years
PAR = (109.20/65.41)^(1/5) – 1 = 10.8%
Using 9.5% Sales growth:
Sales 5yr = Sales TMM * (1 + sales growth rate)^n
where period n is 5 years
Sales 5yr = 47348 * (1.095)^5 = 74537
EPS 5yr = 74537 * .207 / 2800 = 5.51
Once you have projected five year EPS, the calculation for PAR is the same as for EPS growth.
FV (price) = EPS 5yr * Avg Annual PE
FV = 5.51 * 20 = 110.20
PAR = (FV / PV) ^ n
where period n is 5 years
PAR = (110.20/65.41)^(1/5) – 1 = 11.0%
There are several ways to do these calculations. They can be done with a high school math calculator. Value Line Investment Analyzer allows the creation of user defined fields. The PAR calculations can be done in user defined fields. Alternatively, the Value Line data can be exported to a spreadsheet or data base and the calculations can be done there.
The advantage of calculating PAR is that it can combined with other parameters to screen the Value Line data base. For example, the attached screen is for all stocks in the Value Line 1,700 stock data base with a PAR of more than 15%, a Value Line Financial Quality Rating of B++ or better and an “RQR” quality ratings of 65 or higher. The screen yielded 61 stocks.
PAR is well suited for screening and for comparing stocks within a portfolio, especially when combined with a parameter that measures quality. It provides more consistent results and a better basis for comparison (than Total Return) — assuming that the future average annual PE is estimated in a consistent manner. It also allows for screening of stocks before doing an SSG. The PAR calculation in the SSG is simply based on the high and low PE assigned in Sections 4a and 4b, but that requires some judgment.
Deploying Available Cash
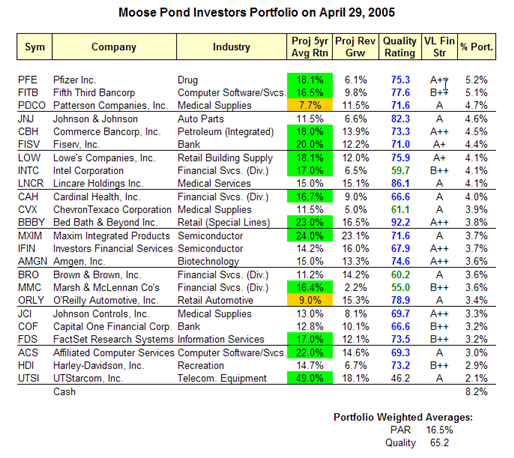
Here is our current portfolio sorted by the relative weight of our holdings. We are 8.2% in cash. We can purchase shares in an additional company and/or we can buy additional shares of companies we already own.
I’ll post the results of some recent screens showing quality and projected average return (PAR). Given the current market conditions, staying with quality stocks (e.g., quality rating > 65 and VL Financial Strength Rating >= B++) with high projected average return (e.g., PAR > 15%) seems like a good idea.
Quality Growth Screen
Here is a Quality Growth Screen using Value Line data. Projected average return was calculated from Value Line data in two ways One calulation sued projected EPS growth, the other used projected sales growth.
Evaluating Energy Stocks
Energy stocks are difficult to assess. The standard NAIC growth stock methodology does seem not work particularly well with energy companies since their revenues are driven in part by the pricing of the underlying commodity (oil or gas).
Kurt Wulff maintains the “McDeb” website which contains a weekly analysis of energy stocks. He was written up in Barrons earlier this year.
He has developed the McDep ratio which compares a company’s market value and debt to its present value. (“McDep” stands for market cap and debt to present value.) The ratio provides a useful way to compare energy companies and to assess relative market valuation.
In addition to preparing a weekly analysis called the “Meter Reader,” Kurt Wulff also profiles individual energy companies.
The site is free and does not require registration. The information on the site lags a week or two from when he provides it to his paying clients.
ChevronTexaco has a projected average return (PAR) of 10.4% and a quality rating of 64. More importantly, CVX has a McDep ratio of 0.77. This means that CVX is undervalued. A ratio of 1.0 would mean that ChevronTexaco’s market value and debt equaled its its present value. This McDep ratio calculation assumes $37 bbl oil. (This is a conservative assumption since futures contracts over the next six years are currently priced at $51 bbl.) See Wulff’s assessment of ChevronTexaco.
Teva Pharmaceutical Ind.
The April 2005 Better Investing magazine featured Teva Pharmaceutical Industries as a stock to study. Here is a PowerPoint presentation and stock selection guide analyzing Teva.
Here is the bottom Line: TEVA is a good quality stock. Value Line financial strength is A but earnings predictability is only 55, RQR is 58.5. It currently has an upside/downside ratio of 4.3 and a relative value is 106. It has an estimated total return of 20.4% (assuming a 5-yr high PE of 24.8) and projected average return of 16.0%.
Berkshire Hathaway
The annual reports for Berkshire Hathaway include Warren Buffet’s letters to shareholders. In addition to discussing the state of the company, these letters contain sage investment advice applicable to all investors, including small investors. Here is an excerpt from this year’s letter.
Over the 35 years, American business has delivered terrific results. It should therefore have been easy for investors to earn juicy returns: All they had to do was piggyback Corporate America in a diversified, low-expense way. An index fund that they never touched would have done the job. Instead many investors have had experiences ranging from mediocre to disastrous.
There have been three primary causes: first, high costs, usually because investors traded excessively or spent far too much on investment management; second, portfolio decisions based on tips and fads rather than on thoughtful, quantified evaluation of businesses; and third, a start-and-stop approach to the market marked by untimely entries (after an advance has been long underway) and exits (after periods of stagnation or decline). Investors should remember that excitement and expenses are their enemies. And if they insist on trying to time their participation in equities, they should try to be fearful when others are greedy and greedy only when others are fearful.
Portfolio Summary Updated
The portfolio summary has been updated.
We now have more in cash to invest. Kudos to those members who are saving and investing regularly. With the recent market down trend, we should continue to purchase new shares. It’s always better to buy stocks when they are on sale.
Here are two proposals.
Proposal 1. Replace Federal Home Loan Management Corp (FNM) with Fifth Third Bank Corp (FITB), a well managed mid-west bank. Most of the literature about FITB has been very positive. See attached SSG and related reports (e.g., Morningstar, S&P and Value Line). We would sell FNM and apply the proceeds to FITB.
Proposal 2. Use the remaining funds to purchase additional shares of four of our existing stocks with the best prospects, considering both quality and projected return. We would add to our holdings of each of the following stocks: PFE, FISV, ACS and BBY. (Note there other strong candidates for reinvestment, including LOW, CBH and AMGN.)
Financial Services Outlook
Here is an interesting article by Tom Brown, CEO of Second Curve Capital, discussing the outlook for 2005 for the financial services industry. The article notes that retail branch growth can’t go on indefinitely. The report is positive about Capital One (COF), Investors Financial Services (IFIN), Commerce Bancorp (CBH) and Morgan Stanley (MWD). (We hold three of these four stocks.) His website is www.bankstocks.com.


