Sold Harley Davidson
Harley-Davidson, Inc. (HDI)
SSG and PERT | Google “Stocks: HDI” |Company Website
 We sold Harley Davidson on June 28, 2006. Although a high quality company, HDI is no longer a growth company. Projected average return is under 8%. The proceeds from the sale were invested in other companies in the portfolio with better long term prospects.
Sold Fifth Third Bancorp
FactSet Research Systems, Inc. (FDS)
SSG and PERT A | Google Stocks | Company Website
 We sold Fifth Third Bancorp on June 28, 2006. FITB’s performance has been subpar for some time. It has also had a defection of senior management people. The proceeds from the sale have been redeployed to other financial stocks in our portfolio that have brighter prospects.
(more…)
Patterson Cos. (PDCO)
SSG and PERT A | Google “Stocks: PDCO” | Company Website
Patterson has had a somewhat mediocre year but the company seems to be on track to improve sales and earnings in fiscal year 2007. (PDCO’s fiscal year begins on April 1.) PDCO has invested in sales and marketing. With its year-end earnings report, PDCO gave earnings per share guidance for 2007 of $1.61-1.64 (about 13% growth).
Growth. Value Line projects revenue growth of about 12% while Morningstar projects 13%. The revised stock selection guide uses 12%. Future growth will come from a combination of internal growth and small acquisitions. Internally, PDCO sets a goal for growth of 4% above the market. Its dental business is currently growing faster than its other lines of business.
Quality. PDCO remains a high quality stock (although Morningstar gives it a narrow moat). Manifest Investing rates quality at 71.3 (out of 100). Value Line rates PDCO’s financial strength an “A” and it earnings predictability 100.
Valuation. Projected average return is 13.5%. PDCO has always sold at relative high PE. Its current PE is about 24. The stock selection guide uses an average future PE of 24.
We purchased PDCO in March 2003 and have enjoyed an annualized return of 12.5%. It represents 2.25% of the portfolio. This would be a good time to add to our position.
Sold Capital One Financial (COF)
We sold COH on June 12, 2007.
Brown & Brown (BRO)
SSG and PERT A Graph | Google “stocks: bro” | Company Website
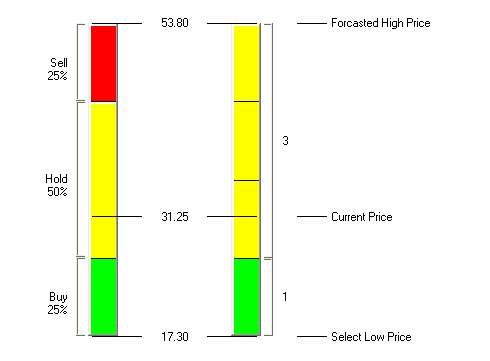
Brown & Brown remains a high quality growth stock. Currently at $31.25, our stock selection guide has BRO a buy up to $26.40 with a projected average return of 8.3%. BRO pays a 0.8% dividend. Its current price makes it a HOLD. We wouldn’t buy more at this price but we are reluctant to exchange this quality company for another.
The Feb 24, 2006, Value Line comments that Brown & Brown has made solid progress
of late and has bright prospects over the coming 3 to 5 years. VL rates BRO’s financial strength as an “A” and earnings predictability as 90. Morningstar also speaks well of the company and projects revenue growth of 16% while Value Line projects revenue growth of 14%. However, Morningstar only gives BRO 2-stars indicating that the current price is high relative to its fair value calculation.
Investor Advisory Service also follows BRO and notes: “Business remains quite solid at insurance broker Brown & Brown. Fourth quarter EPS increased 14%. Sales grew 21%, with internal revenue growth of 5.2%. CEO J. Hyatt Brown notes that 2005 was the thirteenth consecutive year in which Brown & Brown had earnings growth of at least 15%. Acquisitions are clearly an important part of its growth. The past two years were extremely robust in terms of acquisitions, and the company says that its pipeline of new deals is “a strong as ever.” IAS has as a buy up to 28.
Amgen Inc. (AMGN)
SSG and PERT A (12-26-2005) | Google “Stocks: AMGN” | Company Website
 Amgen remains a HOLD. Morningstar provides the following summary of Amgen:
Amgen stands out in an industry dominated by companies trying to creep out of the red. With 37% operating margins last year (excluding acquisition-related charges) and historical margins periodically surpassing 40%, Amgen has proved its ability to translate sales into profits. Even though it invested $2 billion in research and development last year, Amgen still generates plenty of cash, with free cash flow solidly above 20% of sales. With these numbers, Amgen is rewarding investors by both funding future growth and repurchasing shares.
Growth. The Value Line 3-5 year growth projection for revenue growth is 18.5% and EPS is 10%. M* only forecasts 15% revenue growth. The attached stock selection guide uses revenue growth of 17%. Using the preferred procedure, this results in EPS growth of 15.5% and a projected 5-year EPS of $5.88.
Quality. AMGN is high quality company with Value Line rating Financial Strength A++ and Earning Predictability 95. Section 2 of the SSG shows average return on equity (ROE) of 16.8% and average pretax margin of 41.6%. The RQR quality rating is 78.2.
Valuation. Applying the above and a conservative future average PE of 23, the projected average return is 10.8% making Amgen a HOLD. M* rates AMNG four stars meaning the stock is under valued.
Synovus Fin. Corp. (SNV)
SSG and PERT A (11-12-2005) | Google “stocks: snv” | Company Website
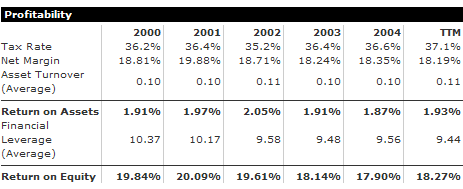
We took an initial position today in SNV. It has a projected average return of 18.7% and a RQR quality rating of 70.1. The director of investor relations spoke at the Better Investing National Conference in Atlanta. Two key points from the presentation were that SNV is well managed and the price of banks have been driven down based on concern about bank profitability due to the increase in long term interest rates. SNV has maintained very solid profitability with an return on assets (a key metric for banks) of about 1.9%. Return on equity has been steady aroud 18%. See Morningstar profitability summary below.
 |
Business Description. Synovus Financial Corp., a holding company, provides various financial services. It operates in two segments, Financial Services and Transaction Processing Services (TPS).
The Financial Services segment provides commercial banking services, including commercial, financial, agricultural, and real estate loans; retail banking services, including accepting demand and savings deposits; individual, consumer, installment, and mortgage loans; safe deposit services; leasing services; automated banking and fund transfer services; and bank credit card services. It also provides portfolio management services; securities brokerage; trust services; insurance agency services; financial planning services; asset management services; and investment advisory services.
The TPS segment primarily provides electronic payment processing services in the United States, Canada, Mexico, Honduras, Puerto Rico, and Europe. It also provides back-end processing services to support merchant processing and offers other products and services to support its processing services. In addition, the TPS segment provides commercial printing and related services; programming support and assistance with the conversion of card portfolios to TS2; recovery collections, bankruptcy process and legal account management, and skip tracing services; Internet, Intranet, and client/server software solutions for commercial card management programs; targeted loyalty consulting, as well as travel, gift card, and reward programs; gift card processing services to Japanese clients; prepaid card solutions; and sells and leases computer related equipment associated with its electronic payment processing services. As of April 26, 2005, Synovus operated 41 banks and other Synovus’ offices in Georgia, Alabama, South Carolina, Florida, and Tennessee. The company was formed in 1888 and was formerly known as CB&T Bancshares, Inc. It changed its name to Synovus Financial Corp. in 1989. Synovus is headquartered in Columbus, Georgia.
Occidental Petroleum (OXY)
SSG and PERT A (11-17-2005) | Google “stocks: oxy” | Company Website
We took an initial position today in OXY (and increased our existing position in Chevron). This is our second energy stock. For an assessment of OXY, see the October 15 report by McDep Associates. OXY has the lowest ratio of market capitalization and debt to present value (“McDep” ratio) making it the best value among the medium and large cap independent oil and gas producers. Value Line rates its financial strength A+. OXY pays a 1.5% dividend.
Business Description. Occidental Petroleum Corporation primarily engages in the exploration for, development, production, and marketing of crude oil and natural gas in the United States, Latin America, and Middle East. As of December 31, 2004, the company had proved reserves of 2,489 million barrels of oil and gas equivalent. Occidental Petroleum also manufactures and markets basic chemicals, such as chlorine, caustic soda, potassium chemicals, and their derivatives; vinyls, including polyvinyl chloride (PVC), vinyl chloride monomer, and ethylene dichloride; and performance chemicals, including chlorinated isocyanurates, resorcinol, antimony oxide, mercaptans, and sodium silicates. PVC resins are used in piping, electrical insulation, external construction materials, flooring, medical and automotive products, and packaging. The company markets its chemical products to industrial users or distributors through its own sales force. Occidental Petroleum is headquartered in Los Angels, California.
Sold O’Reilly Automotive
SSG and PERT A (11-08-2005)
|
Google “stocks: orly”
|
Company Website
 Reluctantly, we sold ORLY and redeployed the cash. It has been a good performer but we needed to reduce the number of stocks in the portfolio (moving torward a total of 20 stocks). Although ORLY remains a quality company, the project average return dropped to 7.5%. We have replaced it with a stock of comparable quality and higher return.
(more…)
Sold Lincare Holdings
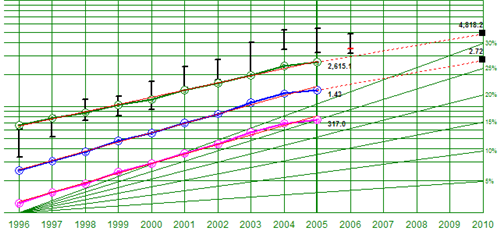
We sold LNCR today and redeployed the cash. LNCR’s revenue and earnings growth has declined over the past two years. See PERT A graph (above). Lower federal reimbursement for supplemental oxygen has cut into its margins. We used the above stock selection guide in making this decision.
(more…)

