Good News for January
For the month of January, the Moose Pond portfolio is up 3.6% (in comparison with 1.4% for the S&P 500). We may be back on track. As of today, Feb 2, the portfolio return is up 4.5%, compared with 1.95% for the S&P 500. That is good news!
This month we sold UTStarcom (UTSI) for a loss of $717 and Investors Financial (IFIN) for gain $199. We are 6.8% in cash. We will be using some of that cash to round out our holdings of Walgreens (WAG) and will park the rest in the Vanguard Total Market Index (VTI).
Getty Images really took off this month, up 15%. They did better than the analysts expected. We are back in the black for that stock.
We have two stocks that have doubled since we bought them. Lowes (LOW), one of our first stocks, is up 248% for an annualized return of 22.4%. Factset Research Service (FDS) is up 123% for an annualized return of 32.3%. We need a few more stocks like them.
You can see the entire portfolio at Manifest Investing.
How Are We Doing?
So how are we doing so far this year on return? The answer is OK, but not as well as we should be doing. We have an internal rate of return of 7.3% year to date. (Internal rate of return takes into account when we receive funds. It is a more accurate measure of performance.) 7.3% is in line with the Wilshire Large Growth Stock index which is up 8.5%. However, some of the broader market indices have done much better, such as the the Wilshire 5000 which reflects the total market, is up 13.2% for the year.
How we are doing depends on the index to which we compare our portfolio performance. Here is a table showing year to date return data taken from the Wall Street Journal as of Wednesday, November 22.
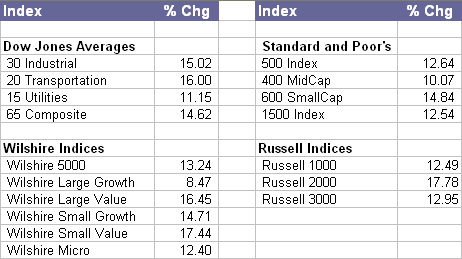
Note that value stocks and small stocks have out performed both large and growth stocks. This has been a trend for a number of recent years. If you want to compare investment returns by asset class (large, small, value growth, etc.) take a look at the Callan Periodic Table of Investment Returns.
 As you can see from the matrix on the right, our portfolio is weighted heavily toward large growth stocks. It was only some recent purchases of GYI and VTI that improved our style balance. Large growth stocks have not done as well as the smaller stocks and the value stocks this year. We need to include more small and medium size companies in our portfolio. It may be inconsistent with an NAIC approach, but we also need some value stocks. Value stocks are generally defined as ones have lower price to earnings or low price to book ratios.
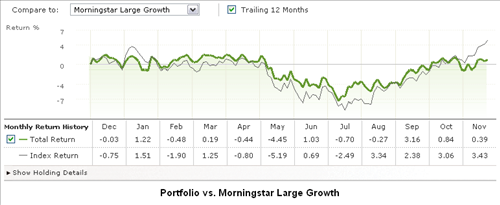
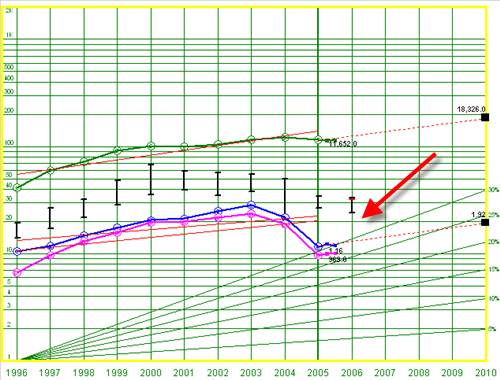
The next two graphs compare our portfolio return over the past 12 months with two Morningstar indices. The first graph compares our return to the Morningstar large growth index. Our return tracks that index fairly closely.
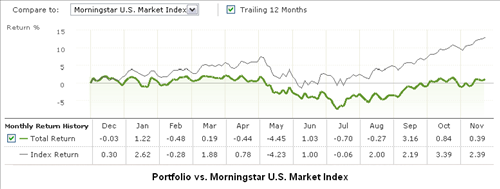
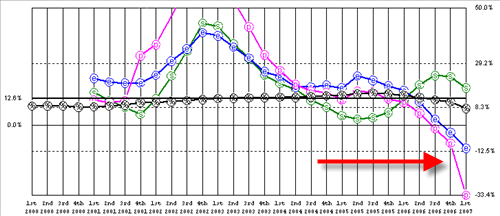
The second graph, below, compares our return with the Morningstar U.S. market index. This is a broad index that includes all stocks. We are not doing as well as that index.
+GYI +WAG -ACS -MMC
Based on our email discussion, we sold Affiliated Computer Services and Marsh & McClennan Companies. We took an initial position in Getty Images and Walgreen Co. (The links will take you to the stock selection guide we used.) We can purchase more of these when either of these stocks dip in price.
These two additions have raised the overall quality rating (now 70.3) and the projected average return (12.3%). See portfolio dashboard here.
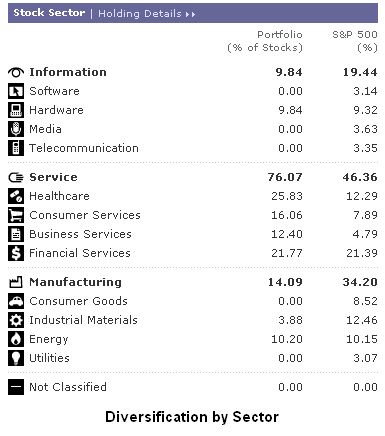
Looking at portfolio diversification, we are diversified across seven sectors. We are still weighted a little too heavy in the health care sector. Here is table from Morningstar showing our actual diversification.
Walgreen Company (WAG)
SSG and PERT | Google Stocks | Company Website
 We purchased an initial position in Walgreens on November 22. Here is the stock selection guide we used for the purchase decision.
Sold Getty Images, Inc. (GYI)
SSG and PERT | Google Stocks | Company Website

We sold our position in GYI on August 28, 2007. The price was $31.04. The reason for selling was declining earnings prospects. GYI is facing stiff competition from other sellers of image.
We purchased an initial position in Getty Images on November 22, 2006. Here is the stock selection guide we used for the purchase decision.
Sold Affiliated Computer Svc
Affiliated Computer Services (ACS)
SSG and PERT A (12-26-2005) | Google “Stocks: ACS” | Company Website
![]()
We sold Affiliated Computer Systems on November 11, 2006 at $29.74. We had a long term gain of $13. We originally purchased ACS in November 2003.
Rationale for sale: ACS seems unable to move forward. Click here for a SSG. As the chart below shows, it seem it has been unable to grow its revenue and earnings in any significant way over the past 4-5 quarters. It is now mired in an options pricing mess and will have to restate its earnings. ACS failed to fully report its current quarter and instead offered up instead “non-GAAP” (GAAP = generally accepted accounting principles) metrics of performance. Its TTM pre-tax margin (10.5%) is below the industry average (15.8%). Morningstar still rates ACS 4-stars but also rates it F for stewardship.
Sold Marsh & McLennan Cos.
SSG and PERT A Graph | Google “stocks: mmc” | Company Website
We sold Marsh & McClennan on November 11 at $32.01. This gave us a long term capital gain of $143.18. We had originally purchased MMC in November 2004.
Rationale for the sale: MMC has not yet recovered from its myriad of regulatory problems. Click here for a SSG. It has failed to re-establish growth in either revenues or earnings. Return on equity and pretax margins have dipped significantly, with no immediate sign of recovery. It may be a good value stock (Morningstar rates it 4-stars) but it currently fails as a quality growth stock. We have replaced it with GYI and WAG.
Getting Ready for Winter
Most of our companies have announced their 3rd quarter results. Here is an updated PERT chart (portfolio evaluation review technique). Also, here is the portfolio summary. The average quality rating for the portfolio is 67.5 (65 is very good) and average projected average return is 13.3%.
In looking across the portfolio, two, possibly three, companies seem like good candidates for replacement. These are Marsh & McClennan (MMC) and Affiliated Computer Systems (ACS). The third possibility is Pfizer (PFE). We may want to consider replacing these companies with smaller quality companies with better growth prospects. Also, we should look at adding to our position in some of our better holdings.
Marsh & McClennan has not yet recovered from its myriad of regulatory problems. Click here for a SSG. It has failed to re-establish growth in either revenues or earnings. Return on equity and pretax margins have dipped significantly, with no immediate sign of recovery. It may be a good value stock (Morningstar rates it 4-stars) but it currently fails as a quality growth stock. MMC is a prime candidate for replacement.
Affiliated Computer Systems seems unable to move forward. Click here for a SSG. As the chart below shows, it seem it has been unable to grow its revenue and earnings in any significant way over the past 4-5 quarters. It is now mired in an options pricing mess and will have to restate its earnings. ACS failed to fully report its current quarter and instead offered up instead “non-GAAP” (GAAP = generally accepted accounting principles) metrics of performance. Its TTM pre-tax margin (10.5%) is below the industry average (15.8%). Morningstar still rates ACS 4-stars but also rates it F for stewardship. ACS may be a decent company about to turn the corner — assuming its options pricing problem doesn’t get worse — but it seems to be another prime candidate for replacement.
Pfizer is no longer a classic growth stock. It’s price has rebounded in the last 12 months up more then 22%. However, both growth and quality of earnings are in doubt gonig forward. Sales projections over the next 5 years vary from 2.6% to 6%. Click here for a SSG. PFE might be a good candidate for replacement.
Quarterly Report
We finally saw decent portfolio gains this quarter in the Moose Pond portfolio. Here are the details.
For the quarter justed ended, our net gain is +3.5%. For comparison, the S&P 500 rose +5.2% for the same period. The five stocks advancing the most were: PFE (+21.9%), SYK (+17.8%), UTSI (+13.9%), AMGN (+15.4%), and JKHY (+11.1%). The five stocks declining the most this quater were: MXIM (-6.0%), COF (-7.9%), LOW (-7.3%), OXY (-5.99), and ITW (5.11).
Looking back over the past 12 months, the portfolio gained +6.3%. (compared to 8.7% for the S&P 500). The big gainers were: FDS (+38.6%), IFIN (+31.2%), OXY (+29.4%), BRO (+23.9%), and CBH (+21.3). The decliners were: MXIM (-33.2%), INTC (-11.4%), PDCO (-14.7%), LOW (-14.2%), and COF (-7.9%).
Overall, we have achieved decent performance this quarter. It would be nice to start beating the S&P 500 once again. We need to do a little fine tuning of the portfolio.
YTD Returns
Following up on the earlier posting, this performance report shows year-to-date return for each stock in the portfolio. Stocks with more than 10% return (up or down) are highlighted in yellow. A number of our high quality stocks, have not done well this year.
Stocks down more than 10% year-to-date: COF (-22.9%), LOW (-20.5%), INTC (-16.7%), MMC (-16.1%), AMGN (-13.7%), ACS (-13.2%), and PDCO (-13.0%), Stocks up more than 10% year-to-date: OXY (29.1%), IFIN (+26.0%), PFE (+20.5%), CVX (+15.4%), and SNV (+12.8%). Note that the YTD return is simply a snapshot in time. It does not reflect the overall, long term return we have achieved for these stocks.
We need to to be patient. The business models seem intact for each of the stocks that have declined. (Although we do need to take a hard look at MMC.)