Maxim Integ. Prod. (MXIM)
SSG and PERT | Google Stocks | Company Website

Maxim reported earnings for the fiscal year ending June 24, 2006. The company reported revenue growth of 11.2%. However, net income fell (-14.4%)and diluted EPS fell (14.9%) from $1.578 to $1.372. See Maxim’s press release. The expensing of stock based compensation contributed to the poor earnings.
Maxim and Linear Technologies (LLTC) are similar companies with different niches in the semiconducter industry. They had similar results this year, increased revenue growth but declining earnings. LLTC’s EPS did not decline as much as that of MXIM.
Should we sell MXIM? The short answer is no. The company’s fundamentals — the basis on which we buy or hold stocks — still look very good. On Friday, Maxim reported record-high quarterly revenue as bookings. The company has no long term debt. Net profit margins have remained strong. Value Line projects 20% sales growth and 15.5% earnings growth. The analysts consensus for 5-year earnings growth rate is 20%. Morningstar gives Maxim a 5-start rating (meaning it is priced well below fair value), a wide moat, and a stewardship grade of B. Manifest Investing rates its quality 69.
Whenever the earnings of a growth company falter, the price of the stock usually tumbles. Maxim’s stock price is near its three year low even though the company’s fundamentals and business model appear to be intact.
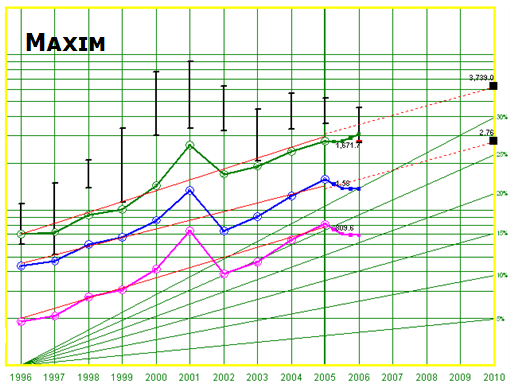
We currently hold 58 shares of Maxim valued at $2,090. It is 4.3% of our portfolio. Our average cost is $35.88 per share. The current share price is $27.94. We have a net loss of $462. (We also have a net loss for Intel, another semiconductor stock.) Revising the stock selection guide for a projected 15% EPS growth, projected average return is 21.5%. At his point, we probably have more to gain than lose by holding Maxim.
(more…)
Report for July 2006
In July, the Moose Pond Investors portfolio declined 0.13% while the S&P 500 increased 0.52%. Year to date, the portfolio declined 0.12% while the S&P increased 2.28%. The unit value of a share was $13.12 on July 31.
The biggest gainers in July were Pfizer (PFE) +10.8%, Stryker Corp. (SYK) +8.1%, and Brown & Co. (BRO) +7.4%. The biggest losers were Capital One Financial (COF) -9.5%, Maxim Integrated products (MXIM) -8.5%, and Factset Research (FDS) -7.2%.
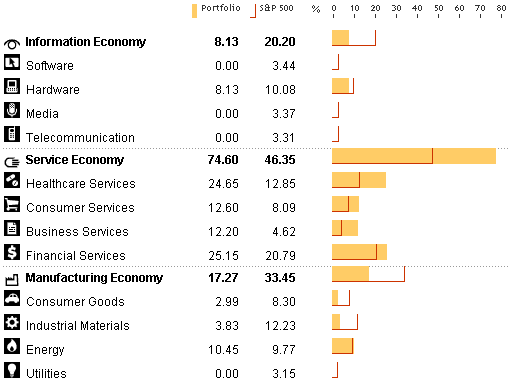
The portfolio remains diversified with 25 holdings. The following chart from Morningstar compares the sector diversification of the portfolio with the S&P 500. In adding to the portfolio, we should probably avoid further overweighting of the services sector.
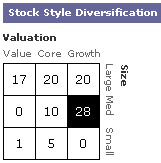 As the chart on the rights shows, the portfolio consists of large cap (57%), medium cap (38%), and small cap (65%) stocks. We should focus on finding more medium and small cap stocks.
Looking at style, the portfolio consist of value (18%), blend (35%), and growth (48%). This mix is probably OK but growth stocks have taking quite a drubbing over the past 12 months. (For a comparison of growth and value stock returns by year see the Callan Periodic Table.)
SSGs Updated
The stock selection guides (SSGs) for each of the stocks in the portfolio have been updated as of June 30. Follow the links in the portfolio summary for the current SSGs.
The PERT Chart and Trend Report also have been updated. The PERT chart is sorted by total return while the trend report is sorted by projected average return.
Mid-Year Report
Unit share price on June 30 was $13.14 up only slightly from the $13.09 at the beginning of the year. The IRR was 0.7%. In comparison, the S&P 500 was up 1.76% for the same six month period. (Actual gain for the S&P will be slightly higher with dividends.)
Top five advancers for the first half of 2006 were: Occidental Petroleum, OXY (+29.4%), Investors Financial, IFIN (+20.2%), FactSet Research Systems, FDS (+15.2%), Chevron, CVX (11.1%), and Maxim Integrated products, MXIM (+5.0%). The five biggest decliners for the same period were: INTC (-20.2%), Amgen, AMGN (-17.6), Affiliated Computer Systems, ACS (-13.8), Marsh & McLennan Companies, MMC (-14.4), and Stryker, SYK (-8.0%).
With the possible exception of MMC, the fundamentals of the decliners remain intact and don’t warrant sale of these stocks. The wide range reflected by the return of the top and bottom stocks for 2006 underscores the importance of diversification and adding regularly to the portfolio.
June Transactions
On Wednesday, we added 18.8 shares of SNV and 23.9 shares of MXIM. We closed our positions in HDI (20.1 shares) and FITB (39.9 shares). On Friday, we added 11.4 shares of JKHY, 9.8 shares of LOW, 12.1 shares of AMGN, and 10.3 shares of COF.
This reduces the number of companies in the portfolio to 24. We only have 1.1% in cash. UTSI jumped for $6.50 to $7.79 this week. So maybe we should hold a while more.
Here is a dashboard for the portfolio reflecting these transactions.
Sold Fifth Third Bancorp
FactSet Research Systems, Inc. (FDS)
SSG and PERT A | Google Stocks | Company Website
 We sold Fifth Third Bancorp on June 28, 2006. FITB’s performance has been subpar for some time. It has also had a defection of senior management people. The proceeds from the sale have been redeployed to other financial stocks in our portfolio that have brighter prospects.
(more…)
Sold Harley Davidson
Harley-Davidson, Inc. (HDI)
SSG and PERT | Google “Stocks: HDI” |Company Website
 We sold Harley Davidson on June 28, 2006. Although a high quality company, HDI is no longer a growth company. Projected average return is under 8%. The proceeds from the sale were invested in other companies in the portfolio with better long term prospects.
Portfolio Realignment
This might be a good time to do some late spring cleaning on our portfolio. We have 26 companies in our portfolio. Reducing the number of companies to around 20 would help eliminate the stocks with the lowest projected return.
Portfolio Evaluation Tools
There are two tools that can help with this portfolio The Portfolio Evaluation Review Technique or PERT chart takes most of the important data from the stock selection guide and arrays it logically for each stock in the portfolio. It is very useful for comparing stocks in a portfolio. Take look at the PERT chart for the portfolio. (The attached PERT report is sorted by Compound Annual Rate of Return from lowest to highest total report.)
The left side of the PERT chart shows how EPS, sales, pre-tax profit have changed in the current quarter. It also shows how the trailing 12 month EPS. The pink areas show growth less than 15%. If a stock has a pink shaded area, it is a good idea to learn why.
Several nuances of the a PERT chart generated with the Toolkit software are important to understand. First, the current P/E is actually the forward P/E, that is, the projected EPS for the next 12 months divided by the current price. The PERT chart uses analyst consensus earnings for the next 12 months. Second, the compound annual return total return uses the 12 month EPS estimate extended out 4 more years using the EPS growth rate. This approach obviously relies on the accuracy of the 12 month EPS projection and the 5 year PES growth rate but is certainly a good approach.
The Portfolio Trend Report is also a good tool for comparing stocks in a portfolio. It also uses data from the stock selection guide. It shows Total Return and Projected Average Return (PAR). Remember, Total Return uses a projected 5-year high PE while PAR uses an average 5-year PE. (Note that Total Return differs slightly from compound average annual return on the PERT chart.)
Proposed Portfolio Realignments
Here are some proposed changes to our current portfolio:
1. Sell Harley Davidson (HDI). Although a high quality company, HDI is no longer a growth company. Projected average return is under 8%. The proceeds from the sale can be invested in other companies in the portfolio with better long term prospects.
2. Sell Fifth Third Bank Corp (FITB). We hold several financial stocks in the portfolio: Commerce Bankcorp. (CBH); Capital One Financial (COF), and Synovus (SNV). FITB seems to rank fourth among these. It has a hard time establishing itself as it expand and there has been a turnover of a number of senior executives. The proceeds could be used to bring our positions in CBH, SNC, and COF up to 5% each.
3. Sell UTStarcom (UTSI). OK, it’s official. This stock is a loser (and I originally recommeded it). It might be better to take the loss and move on. Lesson learned — growth that looks to good to be true, probably is too good to be true.
4. The proceeds from the sale of HDI, FITB, and UTSI could used to add to positions in those stocks with a projected average return of 15% or better. (See attached speadsheet.) Here are the proposed additions:
$800 Amgen (AMGN) – PAR of 16.8%
$900 Capital One Financial (COF) – PAR of 12.7%*
$230 Jack Henry & Associates, Inc. (JKHY) – PAR of 16.9%
$600 Lowe’s Companies Inc. (LOW) – PAR of 16.7%
$750 Maxim Integrated Prod Inc. (MXIM) – PAR of 18.6%
$500 Synovus Financial Corp. (SNV) – PAR of 17.8%
* COF is our lowest PAR. However, we used a very conservative estimate. COF seems to be a good prospect.
While this looks like quite a few transactions, it only includes $922 of new cash. Rebalancing to 5% among our stronger companies should improve the quality of the overall portfolio. The transaction costs are relatively small ($3 x 9 =$27). The proposed changes are summarized in this spreadsheet.
Purchased More PDCO
Purchased additional shares of Patterson Companies at $34.80. Here is the stock selection guide.
Patterson Cos. (PDCO)
SSG and PERT A | Google “Stocks: PDCO” | Company Website
![]()
Patterson has had a somewhat mediocre year but the company seems to be on track to improve sales and earnings in fiscal year 2007. (PDCO’s fiscal year begins on April 1.) PDCO has invested in sales and marketing. With its year-end earnings report, PDCO gave earnings per share guidance for 2007 of $1.61-1.64 (about 13% growth).
Growth. Value Line projects revenue growth of about 12% while Morningstar projects 13%. The revised stock selection guide uses 12%. Future growth will come from a combination of internal growth and small acquisitions. Internally, PDCO sets a goal for growth of 4% above the market. Its dental business is currently growing faster than its other lines of business.
Quality. PDCO remains a high quality stock (although Morningstar gives it a narrow moat). Manifest Investing rates quality at 71.3 (out of 100). Value Line rates PDCO’s financial strength an “A” and it earnings predictability 100.
Valuation. Projected average return is 13.5%. PDCO has always sold at relative high PE. Its current PE is about 24. The stock selection guide uses an average future PE of 24.
We purchased PDCO in March 2003 and have enjoyed an annualized return of 12.5%. It represents 2.25% of the portfolio. This would be a good time to add to our position.
