Weathering the Storm
Despite the tumultuous week on Wall Street, our portfolio weathered the storm. Since the beginning of the of the year, the value of a unit share in Moose Pond Investors declined about 2% from $13.647 to $13.375. However, the overall stock market declined 13.1% for the same period (using the Wilshire 5000 index). Our internal rate of return, which takes into account all cash flows for the portfolio, for the same period is -2.5%. Here is a detailed YTD performance report.
AIG was the big loser, dropping 93%. The stock is probably a lost cause. Good thing we didn’t but any more! The other contributors to our losses this year were Synovus Financial (-50.8%), Total System Services (-35.2%), Microsoft -28.5%), and Intel (-26.5%).
An astute reader of this blog pointed out that most of the drop in price for Synovus Financial (-50.8%) this year was a result of the spin-off of TSS in January. That’s exactly correct. Just looking at the price of SNV does not tell the whole story.  At the beginning of the year, our holdings in SNV had a value of $1,758. SNV and TSS currently have a combined value of $1,392. So the actual decline in value this year is only 20.8%.
But for the losses on AIG and TSS, we would have been in positive territory for 2008.
We do have some winners this year. They include Helmerich & Payne (+40.3). Wells Fargo & Co. (+36.2%), Amgen (+29.1%), Sun Hydraulics (+26.4%), and Lowes (+26.3%). This underscores the importance of diversification and quality in a portfolio.
Take a look at the portfolio dashboard from Manifest Investing. We may want to consider selling Bed, Bath & Beyond and Brown & Brown. At the same time, we may want to slightly increase our holdings in Microsoft, Walgreen, Transoceanic, and FactSet Research. Each of these companies have a high quality rating and high projected average return.
Market Reaction to Earnings Estimates – SNHY
It is always interesting to watch the market reaction to quarterly earnings reports. Small variances between reported earnings and analyst expectations, especially in growth stocks, frequently result in sharp price fluctuations. More often than not, the change in price has nothing to do with the underlying business model of the company. A case in point is Sun Hydraulics, one of our holdings.
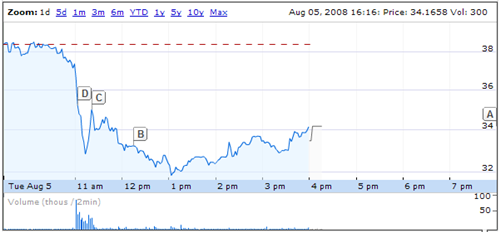
Sun Hydraulics Corp., SNHY, reported Q2 (June) earnings of $0.54 per share, $0.04 better than the First Call consensus of $0.50. Quarterly revenues rose 18.8% year over year to $51.6M vs. the $51.4M analyst consensus. (Q3 earnings press release.)
However, the company reduced its outlook for Q3, projecting EPS of $0.35-0.37 which is slightly lower than the $0.42 analyst consensus. The company also projected Q3 revenues of $45M which is slightly lower than $47.93M analysis consensus. Here is the company’s statement regarding Q3.
“Sun’s products are used in diversified equipment markets around the globe,” stated Carlson. “Many of these markets, such as mining and energy, remain strong and demand is high. In other more obvious markets, such as equipment used in residential and commercial construction, we have begun to see some softening.”
“The diversity of our end markets, both geographically and the segments we participate in, is pivotal to maintaining our growth,” concluded Carlson.
2008 third quarter sales are estimated to be approximately $45 million, a 9% increase over last year. Third quarter earnings per share are estimated to be between $0.35 and $0.37 per share, compared to $0.32 per share last year. EPS estimates for the third quarter include a charge of $775K for U.S. income taxes due on the repatriation of $6 million from Sun Germany in July 2008.
This slightly reduced guidance caused the stock to drop 11.24% on August 5 after it announced its earnings.
Here is an updated stock selection guide that incorporates the Q3 data. It use a conservative estimated of 18% for revenue and sales growth. It also uses a conservative 5-year average average P/E of 16.9. The SSG still shows a projected average return of 13.7%. The fundamental business model of the company has not changed. It is still a strong hold. Despite teh drop in price yesterday, we have a 17.2% annualized return on SNHY.
Transactions:Â Â GRMN, LOW, RIG, and HP
On July 29, we purchased:
- 15.372 additional shares of Garmin Ltd. (GRMN) at $45.34
- 39.416 additional shares of Lowe’s Companies Inc (LOW) at $20.22
- 11.974 initial shares of Transocean Inc. (RIG) at $133.62
We sold 27 shares of Helmerich & Payne Inc (HP), a gas and drilling company, at $57.27 reducing the weight of this holding to 2.9%. Transocean, a deep sea oil and gas drilling company,
On July 30, we purchased an additional 15.682 shares of Garmin at $39.250. Garmin took quite a beating last week when it reduced its 2008 earnings guidance from $4.40 to $4.13 per share. Garmin also reduced its revenue guidance from $4.5 billion to $3.9 billion. It appears that the bad news is more than reflected in the current stock price of $33.64.
A stock selection guide (SSG) for Garmin can be found here. This SSG assumes a reduced revenue growth of 12% and a reduced pre-tax profit marin in five years. The SSG assumes a future P/E of 15 (current P/E is 8). The projected average return is 23.1%.
Transocean Inc. (RIG)
If the current high price of crude oil reflects a fundamental change in the world-wide demand for oil, as many suggest (see Sunday Washington Post article), then prospects may be bright for oil services stocks. We have one oil services stock in our portfolio, Helmerich & Payne (HP). The stock is at $52.90 per share, up from the $33.72 we paid for it last June. HP is 6.8% of our portfolio. HP provides contract drilling services to oil and gas producers primarily in the United States, Argentina, Colombia, Ecuador, and Venezuela.
It might be wise to diversify and include deep water drilling company. Transocean Inc. (RIG) pops up in numerous screens and articles. Value Line describes Transocean as the world’s largest offshore drilling contractor, working in all the major offshore regions, including the Gulf of Mexico, the North Sea, the Middle East, and off the coasts of West Africa, the United Kingdom, Norway, Brazil, and Canada. It specializes in technically demanding deep-water/harsh-environment drilling projects.
Here is a stock selection guide for Transocean. Manifest Investing estimates a projected average return of 19.3%. Morningstar rates Transocean 5-stars (undervalued) and calculates fair vale as $176 (current price is $133). We should consider selling part of our position in HP and buying RIG.
Maxim Integrated Products
Maxim Integrated Products (MXIM or MXIM.PK) has been one of our disappointing holdings. We bought an initial position in February 2005 at $39.44 per share and added to that position in June 2006 at $31.33 per share thinking the worst was over for the stock. The stock is currently priced at $18.35, down from its $55 high in 2004.
Maxim got caught up in an options backdating scandal. Nasdaq delisted it. And it has taken the company a long time to restate its financials, which has resulted in significant legal and accounting fees.
Barron’s reports today:
Now there are signs that the worst may be over. The company, with a market value of $6 billion, has submitted revised financial statements to its auditors. Earnings are expected to pick up next year, as the legal expenses of the probe recede into the past. And conditions in the chip industry could start to improve markedly within a couple of years.
Result: The stock could rocket by more than 40%. The hope is that growth investors, who abandoned the shares over the past couple of years, will start returning in force. What they’ll find is a stock that trades at a sharp discount to its peers and boasts $1.2 billion of cash and no debt.
Value Line stopped covering Maxim when it was delisted. However, Morningstar still follows the company and rates it 5-stars (undervalued) and gives it a fair value estimate of $34. Here are some excerpts from the Morningstar Report from May:
We consider Maxim Integrated Products one of the better long-term semiconductor investments. With attractive products, sought-after talent, and a plausible plan for growth, Maxim should continue generating healthy returns on invested capital for many years. …Â Maxim is well positioned in its core business of high-performance analog (HPA) chips, which are complex and proprietary by nature. Armed with one of the most talented design teams in the industry, Maxim has been able to produce superior designs that command a price premium. … We now expect Maxim to grow sales at a compound annual rate of 8.2% for the next seven years, down from the 13% assumption used in our previous model. Although we expect the consumer business to be highly competitive, we think Maxim’s gross margins will likely remain in the low 60s. … We forecast operating margins in the low 30s.
Until the SEC approves its revised financial statements, Maxim is limited on the information it may release publicly. This makes analysis of the company difficult.
Maxim will release financial results for the fourth quarter of its 2008 fiscal year on Thursday, August 7, 2008. A video replay of the earnigns conference can be found on the investors section of the Maxim website.
Some Portfolio Adjustments?
Here is the Public Dashboard from Manifest Investing for the Moose Pond portfolio. Overall, the portfolio shows a projected average return of 15.6% and a quality rating of 72.2. The dashboard is forward looking. Manifest Investing uses data from Value Line, Yahoo Finance, and other sources to estimate revenue growth, profit margins, and P/E five years out. From this projected data is is easy to project earnings per share and the future price (P/E x EPS). So the dashboard provides a method of comparing stocks within the portfolio. Note that the amount for a given stock is irrelevant in this analysis. What the company might do going forward counts.
Looking across the Moose Pond portfolio, we see a few stocks that warrant a close look.
- Helmerich & Payne has a PAR of 5.7%. This oil field services company has had a good run and is up 78% since we purchased it last June. It is 6.2% of the portfolio. We could take a small profit and sell some of this stock.
- Brown & Brown has been a relatively unexciting holding. We purchased in March 2004. It is down 10% and represents about 1.4% of the portfolio. We might want to consider replacing it.
- AIG has been the worst performer in the portfolio (and a good example of why diversification is so important). It is down 64% since we bought it last June. This is one of those financial stocks that will turn when the financial sector finally does. At some point we may want to add to our AIG holding, if we don’t purchase Berkshire Hathaway.
- We might want to increase our position on few sticks with high PARs, Lowes (21.6%) and Garmin 26.7%. Lowes is 2.5% of our portfolio and Garmin is 1.4%.
Take a close look at the portfolio dashboard and the portfolio valuation report at Bivio.com. We need to make some adjustments to our portfolio.
Berkshire Hathaway
Berkshire Hathaway is usually categorized by analysts as a property & casualty insurance company. It is actually an incredibly interesting, diverse, and successful holding company made up of 10 insurance companies and 66 non-insurance businesses. These diverse and well managed businesses include See’s Candies, NetJets, Flight Safety Safety International, Borsheim’s Jewery, Fruit of the Loom, GEICO Auto Insurance, Benjamin Moore & Co., Dairy Queen, Clayton Homes, and Johns Manville. (See complete list of Berkshire Hathaway businesses.) Berkshire Hathaway also has an investment portfolio valued in excess of $75B.
In 2007, Berkshire Hathaway’s annual revenues totaled $118B. To put their businesses in perspective, insurance premiums were $31.8B while sales and services revenue from the non-insurance businesses was $58.2B. So calling Berkshire an insurance company is not very accurate, but insurance is one of its core businesses.
At the end of 2007, assets for the various Berkshire insurance companies included $39.8B in cash and $86.8B in equities and fixed maturity instruments. These assets include reserves for anticipated covered losses. For the non-insurance businesses, cash and fixed maturity instruments totaled $8.8B. Together, these assets give Berkshire the ability to internally finance its operations. It provides the cash to acquire new businesses. This cash also gives Berkshire the ability to add substantial positions to its investment portfolio.
The breadth of Berkshire’s business and investment holdings make it difficult for analysts to perform cash flow analysis and to estimate earnings. As you can see from the attached file, the Value Line assessment differs from that of Morningstar. (Morningstar appears to be more on the mark although they don’t do a good job explaining their discounted cash flow analysis.)
Warren Buffet and Charlie Munger have managed Berkshire Hathaway form the beginning in 1964. Integrity, honesty, and business acumen have been the hallmarks of their stewardship over the past 43 years. They have set the gold standard for corporate openness and transparency. Their results are unmatched. Share prices have compounded at rate of 21.1% between 1964-2007.  The sheer size of Berkshire Hathaway today will probably prevent it from achieving this high rate of return in the future. Nonetheless, Berkshire shareholders can expect to do well.
Warren Buffet’s annual letters to shareholders can be found here. They should be mandatory reading for every investor.
Morningstar rates Berkshire Hathaway five-stars with a fair market value of $5,100 (for the class B shares, BRK.B). Current price as of this posting is $3,914. Manifest Investing estimates projected average return of 17.5%. Here is a completed stock selection guide for Berkshire Hathaway.
Note: Berkshire Hathaway has two classes of shares. The “B” share ($3,914) is valued at 1/30 of the “A” share ($117,290). Berkshire Hathaway has never paid a dividend or authorized a stock split, so the 21.1% compound annual growth is reflected in the high price of the stock.
Berkshire Hathaway is an excellent core holding. We should consider purchasing purchasing one of the “B” shares with our available cash.
General Electric (GE)
We purchased an initial position in General Electric (GE). It took a huge drop on April 11 when it missed its earnings. Historically, GE never missed earnings. With the drop in price, the dividend alone yields 3.87% based on the April 11 closing price. See attached a stock selection guide. This looks like an excellent buying opportunity. Remember, nothing has changed in GE’s underlying business model between April 11 and 12, despite the 14.8% stock price drop on April 12.
Portfolio Transactions
We sold Stryker Corp (SYK) at $67.48 and replaced it with Medtronic Inc (MDT) at $52.61. We sold Getty Images Inc (GYI) at 31.00 per share. We purchased Superior Energy Services (SPN) at $39.20.
Portfolio Update
As of this past Friday, we survived the market turmoil. The internal rate of return for Moose Pond Investors was 2.4% for the year to date. This slightly lagged the S&P 500, which was up 4.3% for the same period. See performance report.
Several stocks accounted for the mediocre performance.
Getty Images GYI (-38%) had a disappointing quarterly earnings report. Morningstar star reduced its fair market value estimate. Investors Advisory service recommends selling GYI, noting that the company faces increased competition in the Internet photo images market. Morningstar reduced GYI’s moat rating from “wide” to “narrow.” The visual section of the stock selection guide show the downturn. See the current stock selection guide (SSG) which shows a projected average return (PAR) of only 7.6%. My bad for recommending this one. We should probably sell GYI at some point soon.
Amgen AMGN (-26.6%) has been down for the year. However, most of the analyst reports cite its pipeline and consider it a strong long term buy. Here is the current AMGN SSG. Note that the PAR of 22.7% and that assumes a relatively modest EPS growth of 11%. AMGN is definitely a hold and probably a buy. Now if the market will just recognize what we do!
Of course we had several winners YTD as well. These include INTC (+23.7%), ITW (+24.9%), JKHY (+25.2%), and OXY (+27.8%). This highlights the importance of diversification.
Here are three transactions that may improve our portfolio performance for this year.
- Replace Stryker (SYK) with Medtronics (MDT). Stryker has advanced 22% this year. The price increase has diminished its long term prospects. Morningstar rates it two stars (a little over priced). In contrast MDT is rated five stars (a bargain). Both companies are quality medical suppliers, however, the prospects are a little better for MDT.
- Sell Getty Images (GYI). We are better off selling and redeploying the cash.
- Buy Superior Energy Services (SPN). BNP Is a diversified provider of specialized oilfield services and equipment. While oilfield services are cyclical, the prices for oil and gas have not gone down and the demand for oilfield services continues. The SSG for SPN looks strong. Neither Morningstar nor Value Line cover SPN, but it received a five star rating from Standard & Poors. We should move quickly on SNP as it appears particularly undervalued now.