Portfolio Transactions
We sold Stryker Corp (SYK) at $67.48 and replaced it with Medtronic Inc (MDT) at $52.61. We sold Getty Images Inc (GYI) at 31.00 per share. We purchased Superior Energy Services (SPN) at $39.20.
Microsoft (MSFT)
SSG and PERT | Google Finance | Company Website
 We purchased an initial position in Microsoft on June 13, 2007. Here is the stock selection guide we used for the purchase decision.
Portfolio Transactions
We made the following changes to our portfolio:
- Added to our positions in Bed Bath & Beyond (BBBY) and Amgen (AMGN).
- We sold Commerce Bancorp (CBH) and Capital One Financial (COF). There will be replaced with American International Group (AIG) and Wells Fargo (WFC). That will keep the same exposure to financials but with better stocks that have a higher projected average return.
- We purchased Microsoft (MSFT) and SAP AG (SAP).
- We are replacing Occidental Petroleum (OXY) and ChevronTexaxo (CVX) with Conoco Phillips (COP) and Helmerich & Payne (HP). These keep about the same exposure to the energy sector but split between a mega cap oil company and an oil services company. Both companies pay dividends (COP 2.1% and HP 0.6%).
All of these trades together will increase the overall quality and projected average return of the portfolio. See Manifest Investing dashboard. We are still a little ahead of the S&P 500 for the year.
+GYI +WAG -ACS -MMC
Based on our email discussion, we sold Affiliated Computer Services and Marsh & McClennan Companies. We took an initial position in Getty Images and Walgreen Co. (The links will take you to the stock selection guide we used.) We can purchase more of these when either of these stocks dip in price.
These two additions have raised the overall quality rating (now 70.3) and the projected average return (12.3%). See portfolio dashboard here.
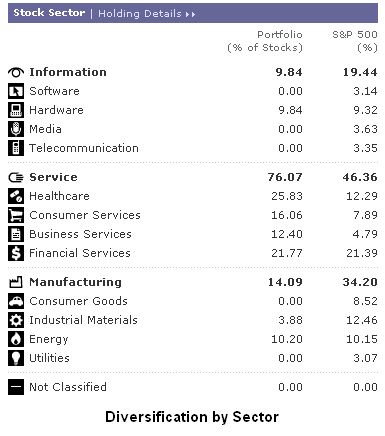
Looking at portfolio diversification, we are diversified across seven sectors. We are still weighted a little too heavy in the health care sector. Here is table from Morningstar showing our actual diversification.
Walgreen Company (WAG)
SSG and PERT | Google Stocks | Company Website
 We purchased an initial position in Walgreens on November 22. Here is the stock selection guide we used for the purchase decision.
June Transactions
On Wednesday, we added 18.8 shares of SNV and 23.9 shares of MXIM. We closed our positions in HDI (20.1 shares) and FITB (39.9 shares). On Friday, we added 11.4 shares of JKHY, 9.8 shares of LOW, 12.1 shares of AMGN, and 10.3 shares of COF.
This reduces the number of companies in the portfolio to 24. We only have 1.1% in cash. UTSI jumped for $6.50 to $7.79 this week. So maybe we should hold a while more.
Here is a dashboard for the portfolio reflecting these transactions.
Sold Fifth Third Bancorp
FactSet Research Systems, Inc. (FDS)
SSG and PERT A | Google Stocks | Company Website
 We sold Fifth Third Bancorp on June 28, 2006. FITB’s performance has been subpar for some time. It has also had a defection of senior management people. The proceeds from the sale have been redeployed to other financial stocks in our portfolio that have brighter prospects.
(more…)
Sold Harley Davidson
Harley-Davidson, Inc. (HDI)
SSG and PERT | Google “Stocks: HDI” |Company Website
 We sold Harley Davidson on June 28, 2006. Although a high quality company, HDI is no longer a growth company. Projected average return is under 8%. The proceeds from the sale were invested in other companies in the portfolio with better long term prospects.
Portfolio Realignment
This might be a good time to do some late spring cleaning on our portfolio. We have 26 companies in our portfolio. Reducing the number of companies to around 20 would help eliminate the stocks with the lowest projected return.
Portfolio Evaluation Tools
There are two tools that can help with this portfolio The Portfolio Evaluation Review Technique or PERT chart takes most of the important data from the stock selection guide and arrays it logically for each stock in the portfolio. It is very useful for comparing stocks in a portfolio. Take look at the PERT chart for the portfolio. (The attached PERT report is sorted by Compound Annual Rate of Return from lowest to highest total report.)
The left side of the PERT chart shows how EPS, sales, pre-tax profit have changed in the current quarter. It also shows how the trailing 12 month EPS. The pink areas show growth less than 15%. If a stock has a pink shaded area, it is a good idea to learn why.
Several nuances of the a PERT chart generated with the Toolkit software are important to understand. First, the current P/E is actually the forward P/E, that is, the projected EPS for the next 12 months divided by the current price. The PERT chart uses analyst consensus earnings for the next 12 months. Second, the compound annual return total return uses the 12 month EPS estimate extended out 4 more years using the EPS growth rate. This approach obviously relies on the accuracy of the 12 month EPS projection and the 5 year PES growth rate but is certainly a good approach.
The Portfolio Trend Report is also a good tool for comparing stocks in a portfolio. It also uses data from the stock selection guide. It shows Total Return and Projected Average Return (PAR). Remember, Total Return uses a projected 5-year high PE while PAR uses an average 5-year PE. (Note that Total Return differs slightly from compound average annual return on the PERT chart.)
Proposed Portfolio Realignments
Here are some proposed changes to our current portfolio:
1. Sell Harley Davidson (HDI). Although a high quality company, HDI is no longer a growth company. Projected average return is under 8%. The proceeds from the sale can be invested in other companies in the portfolio with better long term prospects.
2. Sell Fifth Third Bank Corp (FITB). We hold several financial stocks in the portfolio: Commerce Bankcorp. (CBH); Capital One Financial (COF), and Synovus (SNV). FITB seems to rank fourth among these. It has a hard time establishing itself as it expand and there has been a turnover of a number of senior executives. The proceeds could be used to bring our positions in CBH, SNC, and COF up to 5% each.
3. Sell UTStarcom (UTSI). OK, it’s official. This stock is a loser (and I originally recommeded it). It might be better to take the loss and move on. Lesson learned — growth that looks to good to be true, probably is too good to be true.
4. The proceeds from the sale of HDI, FITB, and UTSI could used to add to positions in those stocks with a projected average return of 15% or better. (See attached speadsheet.) Here are the proposed additions:
$800 Amgen (AMGN) – PAR of 16.8%
$900 Capital One Financial (COF) – PAR of 12.7%*
$230 Jack Henry & Associates, Inc. (JKHY) – PAR of 16.9%
$600 Lowe’s Companies Inc. (LOW) – PAR of 16.7%
$750 Maxim Integrated Prod Inc. (MXIM) – PAR of 18.6%
$500 Synovus Financial Corp. (SNV) – PAR of 17.8%
* COF is our lowest PAR. However, we used a very conservative estimate. COF seems to be a good prospect.
While this looks like quite a few transactions, it only includes $922 of new cash. Rebalancing to 5% among our stronger companies should improve the quality of the overall portfolio. The transaction costs are relatively small ($3 x 9 =$27). The proposed changes are summarized in this spreadsheet.
Purchased More PDCO
Purchased additional shares of Patterson Companies at $34.80. Here is the stock selection guide.