Stocks to Study
Here are several companies we are studying this month in the D.C. Model Investment Club. Any of these might be good replacements for the stocks that we are considering selling.
- Wells Fargo & Company (WFC). Key screening parameters: PAR 13.2%, quality 75.6, current PE 14.4, and projected revenue growth 11%. Stock selection guide.
- East West Bank Corp. (EWBC). Key screening parameters: PAR 14.4%, quality 80.1, current PE 18.9, and projected revenue growth 17%. Stock selection guide.
- Medtronic Corporation (MDT). Key screening parameters: PAR 16.6%, quality 87.7, current PE 24.6, and projected revenue growth 13.5%. Stock selection guide.
- William Wrigley Jr. Company (WWY). Key screening parameters: PAR 13.9%, quality 100, current PE 25.2, and projected revenue growth 10%. Stock selection guide.
Quarterly Report
The net asset value for Moose Pond Investors increased +4.1% in the first quarter of 2006. Unit price is up from $13.10 to $13.65. All of the major indices are up as well: the Dow +3.7%, the Nasdaq +6.1%, the S&P 500 +3.7%, and the Russell 2000 +13.7%. See quarterly performance report.
The portfolio summary on this web site has been updated through March 31. (You can find the portfolio snapshot the “Portfolio Summary” section in left side column.) Also, the stock selection guides linked to the portfolio summary has been updated so you can see how we computed projected average return.
Winner and Losers. Winners for the quarter were: Jack Henry & Associates (JKHY) +27.2%, Johnson & Johnson (JNJ) +20.1%, and Occidental Petroleum (OXY) +16.5%. Losers were: UTStarcom (UTSI) -22.0%, Intel (INTC) -21.7, and Amgen (AMGN) -7.8%. Fortunately the winners outflanked the losers and the net gain for the quarter was $1,260.
Transactions. During the quarter, we purchased new positions in Illinois Tool Works (ITW) and Stryker (SYK). We also added to our position on Intel (INTC). We have continued to reinvest dividends as we receive them.
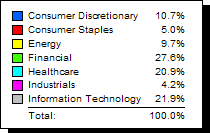
 Diversification. Our holdings are spread across six sectors. The financial services sector (27%) remains our largest sector holding, with technology (21.9%) and healthcare (20.9%) the next largest. See diversification report.
The Way Ahead. We currently have 26 companies in our portfolio. We only need 17 or so to achieve diversification of nonsystematic risk. Nonsystematic risk results from the volatility of the prices of individual companies. Systematic risk comes from volatility of the overall market (e.g., movement of the market — all or most stocks — as a whole). We can’t diversify for that risk within the portfolio. Some people address systemic risk through asset allocation, i.e., investing in various asset classes. Quality growth stocks might be one such class. This gives us the flexibility to reduce the number of companies, without harming our overall diversification.
Looking at the projected average return (PAR) and the current P/E ratios for the companies listed in the portfolio summary, Brown & Brown (BRO) and Cardinal Health (CAH) appear to be candidates for replacement. Patterson Companies (PDCO) also is a possible candidate for replacement.
Report for February 2006
For the first two months of 2006, the Moose Pond Investors portfolio increased in value by 3.1%. In comparison, the S&P 500 index increased 2.6% for the same period.
The best performing stocks were Investors Financial, IFIN (+22.5%), Jack Henry & Associates, JKHY (+15.3%), and Occidental Petroleum, OXY (+15.1%). The worst performing stock was Intel, INTC (-17.5%).
A performance report for 2006 can be downloaded here.
Sold Capital One Financial (COF)
We sold COH on June 12, 2007.
Brown & Brown (BRO)
SSG and PERT A Graph | Google “stocks: bro” | Company Website
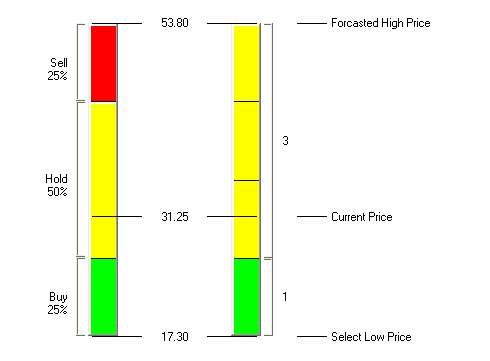
Brown & Brown remains a high quality growth stock. Currently at $31.25, our stock selection guide has BRO a buy up to $26.40 with a projected average return of 8.3%. BRO pays a 0.8% dividend. Its current price makes it a HOLD. We wouldn’t buy more at this price but we are reluctant to exchange this quality company for another.
The Feb 24, 2006, Value Line comments that Brown & Brown has made solid progress
of late and has bright prospects over the coming 3 to 5 years. VL rates BRO’s financial strength as an “A” and earnings predictability as 90. Morningstar also speaks well of the company and projects revenue growth of 16% while Value Line projects revenue growth of 14%. However, Morningstar only gives BRO 2-stars indicating that the current price is high relative to its fair value calculation.
Investor Advisory Service also follows BRO and notes: “Business remains quite solid at insurance broker Brown & Brown. Fourth quarter EPS increased 14%. Sales grew 21%, with internal revenue growth of 5.2%. CEO J. Hyatt Brown notes that 2005 was the thirteenth consecutive year in which Brown & Brown had earnings growth of at least 15%. Acquisitions are clearly an important part of its growth. The past two years were extremely robust in terms of acquisitions, and the company says that its pipeline of new deals is “a strong as ever.” IAS has as a buy up to 28.
Intel Corp. (INTC)
SSG and PERT A | Google “stocks: INTC” | Company Website
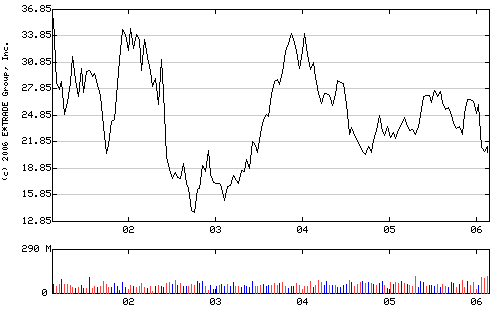
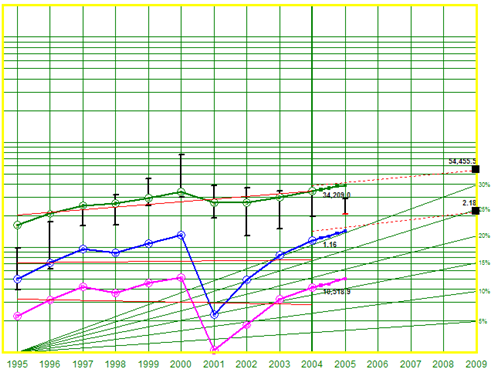
 Here is a revised stock selection guide for Intel Corp. Assuming 7.0% revenue growth and 8.8% earnings growth, the projected average return is 17.0%. Intel quality is high with a RQR rating of 71.6. Value Line rates its financial strength A++ but earnings predicatbility is only 50. As the two charts below show, Intel has contined to grow its earnings over the past four years while the market price has remained relatively constant for the last 18 months.
Lower than expected Q4 and year end earnings, and concerns about INTC losing market share to AMD have caused the share price to drop 17.4% YTD. Concern over AMD may be an overreaction (see story). Intel will be supplying CPU andrealtred chipsfor Apple’s new computers.
Intel remains a strong HOLD.

Annual Report for 2005
Happy New Year to all! We started Moose Pond Investors a little over five years ago. It is hard to believe that five years have gone by. We now have 18 partners made up of family and friends.
Given the amount of effort that went into research and analysis this year, the results for 2005 were a little disappointing. However our 5-year total return is well ahead the S&P 500 (large stock index) and almost even with the Russell 2000 (small stock index).
Here is our Annual Report for 2005.
Amgen Inc. (AMGN)
SSG and PERT A (12-26-2005) | Google “Stocks: AMGN” | Company Website
 Amgen remains a HOLD. Morningstar provides the following summary of Amgen:
Amgen stands out in an industry dominated by companies trying to creep out of the red. With 37% operating margins last year (excluding acquisition-related charges) and historical margins periodically surpassing 40%, Amgen has proved its ability to translate sales into profits. Even though it invested $2 billion in research and development last year, Amgen still generates plenty of cash, with free cash flow solidly above 20% of sales. With these numbers, Amgen is rewarding investors by both funding future growth and repurchasing shares.
Growth. The Value Line 3-5 year growth projection for revenue growth is 18.5% and EPS is 10%. M* only forecasts 15% revenue growth. The attached stock selection guide uses revenue growth of 17%. Using the preferred procedure, this results in EPS growth of 15.5% and a projected 5-year EPS of $5.88.
Quality. AMGN is high quality company with Value Line rating Financial Strength A++ and Earning Predictability 95. Section 2 of the SSG shows average return on equity (ROE) of 16.8% and average pretax margin of 41.6%. The RQR quality rating is 78.2.
Valuation. Applying the above and a conservative future average PE of 23, the projected average return is 10.8% making Amgen a HOLD. M* rates AMNG four stars meaning the stock is under valued.
Investing Philosophy
We invest in quality companies that grow their earnings based on a sound business model. We buy these stocks when they are priced to provide superior long term returns.
While many investors and mutual funds invest in either “growth” or “value” stocks, we
look for companies that have both attributes. Growth, quality, and value are interrelated.
A company should have a sound business model that has demonstrated consistent growth in revenue and earnings over the past 3 to 5 years. The company also should have the potential to sustain growth in revenue and earnings into the foreseeable future.
The quality of a company, which usually reflects strong management, manifests itself in several ways, including: (1) consistent historical growth in revenue and earnings, (2) steady or increasing pre-tax profit margins, (3) steady or increasing return on equity that is greater than the industry median and is generally greater than 15%, and (4) a strong balance sheet.
Value Line ratings of B++ or better for Financial Strength and 85 or better for Earnings Predictability correlate well with quality and good management. We also compare each company’s prospects for future growth and net profit margins with other companies in the same industry. The Manifest Investing quality rating combines these four factors into a single 100 point rating.
Superior long term returns can be assessed in two ways – (1) by calculating intrinsic value for a company using discounted cash flow or (2) estimating the projected average return using a stock selection guide or similar calculation. Using the stock selection guide, we look for a projected average return (PAR) greater than 15%. We also look for quality stocks that sell below their intrinsic value. Morningstar uses a discounted cash flow analysis to determine the fair market (or intrinsic) value of a stock. Stocks rated 4 and 5 stars sell below their intrinsic value. It is generally easier – although not as precise – to compare stocks using their projected average return from the stock selection guide.
We prefer companies that, if purchased, offer the possibility of price earnings (PE) ratio expansion. We generally avoid companies with high PEs, particularly when the PEs have been contracting in recent years. High growth stocks with high PEs are particularly vulnerable to large downward price adjustments if the growth outlook for the company slows down.
Portfolio management is as important, perhaps more important, as selecting good stocks. Several general principles guide our portfolio management:
- Try to stay fully invested and to keep our cash position
below 5%. - Don’t try to time the market.
- Maintain about 20 stocks in our portfolio +/- 5. We reinvest all of our dividends in the companies paying the dividends or in the portfolio.
- Replace a holding if the company’s fundamentals deteriorate or if the company becomes overvalued.
- Replace an individual stock if the replacement company will improve the overall projected average return or the quality of the portfolio.
- Consider diversification when making purchases and try to stay invested in at least five different sectors but there are no strict rules about sector weighting or company size.
Wal-Mart Stores (WMT)
SSG and PERT A (17 Dec 2005) | Google “stocks: wmt” | Company Website
Wal-Mart Stores, Inc. (WMT) operates retail stores in various formats in the United States and internationally. It has two segments: The Wal-Mart Stores and The SAM’S CLUB. The Wal-Mart Stores segment includes Discount Stores, Supercenters, and Neighborhood Markets in the United States, as well as Walmart.com. As of July 31, 2005, Wal-Mart operated 1,276 Wal-Mart stores, 1,838 Supercenter, 92 Neighborhood Markets, and 556 SAM’s Clubs in 50 states in the United States. The company operates various retail formats in Argentina, Brazil, Canada, Germany, Mexico, Puerto Rico, South Korea, and the United Kingdom.
Growth. Value Line projects 3-5 year revenue growth of 12.5% and EPS growth of 13.5%. Reuters reports an analysts consensus EPS growth of 13.7% (based on 16 analysts). M* projects future growth to decline from 13% to 10%. The attached stock selection guide (SSG) assumes revenue growth of 11% and EPS growth of 11.4%. This resulting in a 5-yr EPS of $4.40.
Quality. Wal-Mart is a high quality company. Part 1 of the SSG shows very consistent revenue and earnings growth. From Part 2 of the SSG we see that Wal-Mart has averaged a 20% return on equity over the last five years. Part 2 of the SSG and the PERT chart, and PERT graph (see attached SSG), show consistent pretax margins slightly over 5%. M* gives Wal-Mart a stewardship grade of A. Value Line rates Wal-Mart financial strength A++ and earnings predictability of 100. That is as good as it gets. The Robertson quality rating is 82.3.
Valuation. Wal-Mart has a projected average return (PAR) of 14.3% and total return of 18.2%. See SSG. (Manifest Investing projects PAR as 14.35%.) U/D ratio for Wal-Mart is 10 to 1 and the buy price using 25%-50%-25% zoning is $60.30. (Current price is $49.27.) M* rates Wal-Mart undervalued with five stars.


